People are always asking me how I do my property analysis, and the answer is usually the same…
“Sitting at my computer and often wearing shorts.”
I say it tongue-in-cheek, half kidding because it’s something I do day in and day out. It’s not something special, secret, or miraculous that I do differently than any other real estate investor. To be honest, it’s rather mundane and iterative. But it is something that, with practice and repetition, I’ve become much better at using to make real estate investment decisions.
In this post, I’ll give you an insider’s look into how I run my numbers, the thought process behind it, and a video giving you an over-the-shoulder look at me analyzing actual investment properties on the Roofstock marketplace.

How To Run The Numbers on a Rental Property
Let’s assume I’ve found a rental property that I want to continue analyzing. The first thing I do when running my numbers on a potential property is play a game.
Based on the asking price and the current rental amount, I ask myself, “Do I think this will cash flow day one?” To answer this question, I simply run my numbers as described below.
I play this game on every single property that I evaluate. Why? I want to develop intuition. Every property I analyze, I learn something.
Whether it’s about a particular area’s property tax rates, the typical weather-related maintenance, or even an area’s typical cost of insurance, I’m constantly mining and storing data. That means that each time I play my game, I get better and better.
When I first started investing in real estate, I wasn’t very good at predicting these numbers. It was because I hadn’t yet developed my intuition. Only now, after years of investing, am I starting to get it right a lot of the time.
Once I’ve played my game, I start to get into the meat and potatoes of running my numbers.
I’ve built a spreadsheet where I can input either monthly expenses or annual expenses and it converts it for me into the other form (either monthly or annual). Again, these numbers are often just estimates because until I have a property under contract, I don’t know what the full financial picture looks like. Therefore, I have to make educated guesses.
Below I’ll share what I typically use as benchmarks and rules of thumb to estimate my expenses.
Important note: I always run very conservative numbers because I assume the financial picture will improve if I go into due diligence (DD). My goal is to see the investment from its worst case scenario so I can set a floor for how I think a rental property will perform. You can always be less conservative when you run your numbers.
I assume my operating expenses to be as follows:
- Monthly Property Management Fee: 10% of gross collected income
- Monthly Vacancy Rate: Between 5-8% depending on the property location
- Annual Release Fee: 50% of 1st month’s rent collected
- Annual Property Insurance: 0.8-1.2% of the property purchase price
- Monthly Maintenance: For most single-family rentals (SFRs), I’ll estimate between $75-100 per month.
- Annual Cap Ex Reserves: For most SFRs, depending obviously on the size and age of major components like roof and mechanicals, I use around $1,500 annually.
- Annual Property Tax: Too much variation to give an estimate here so I’ll look up historic taxes using sites like Zillow or Redfin and use those as a starting point until I get the property under contract. Then I call the county assessor’s office to get a more accurate picture of how a sale will affect the taxes.

Once I’ve put together all my expenses, I factor my mortgage payment into the equation, plug in the current rent amount, and voila - out pops a number that’s either positive or negative which represents the projected monthly cash flow on day one.
Once I have an idea for what the cash flow looks like on day one, I start doing some detective work to determine what the cash flow could be. I start asking questions like:
- Are there ways to increase the rents?
- Are the rents under market rate?
- Are there ways to decrease expenses?
- Who pays the utilities? If it’s the owner, can we shift that to the tenants?
- Are there upgrades that can be made to make the property more tenant-proof and reduce ongoing maintenance costs? (These can include installing LVT flooring as opposed to carpets, or installing solid doors as opposed to hollow core.)
- Is there zero-scaping (landscaping that requires little to no water or maintenance and upkeep) that can be implemented which may make the property look nicer while simultaneously reducing the water bill?

Property Analysis in Action
Now let’s look at a real life example using a property from the Roofstock marketplace (full video of my analysis on this specific property is below).
The income property being analyzed is a 5bd/2ba, 2,727 sq. ft. SFR built in 1975 in a 4-star neighborhood. The list price is $199,900 and the current monthly rental income is $2,300. I assume my total expenses to be as follows:
- Monthly Property Management Fee: $230 (10% of gross collected income)
- Monthly Vacancy Rate: 5% or $115 per month (Between 5-8% depending on the property location)
- Annual Release Fee: $1,150 (50% of first month’s rent collected)
- Annual Property Insurance: $1,600 (0.8-1.2% of the property purchase price)
- Monthly Maintenance: $85 (For most SFRs, I’ll estimate between $75-100 per month)
- HOA: $0 (Be sure to find out if there’s an HOA cost during your investment analysis)
- Annual Cap Ex Reserves: $1,200 (For most SFRs, depending obviously on the size and age of major components like roof and mechanicals, I use around $1,500 annually).
- Annual Property Tax: $2,400 (using Roofstock’s default)
Thus, the first thing I want to look at is the monthly net operating income (NOI):
- Monthly NOI = Monthly rent - monthly prop. management fee - monthly vacancy estimate - (monthly release fee/12) - (annual property insurance/12) - monthly maintenance estimate - (annual cap ex reserves estimate/12) - (annual property tax/12)
$2,300 - $230 - $115 - ($1,150/12) - ($1,600/12) - $85 - ($1,200/12) - ($2,400/12) = $1,340/mo in monthly NOI.
This gives us an NOI of $16,600 on an annual basis. However, remember that net operating income does not take into account a mortgage payment.
I like to use a ballpark estimate of $500/mo in mortgage payment for every $100,000 borrowed, assuming a mortgage amount of 80% of the list price and a down payment of 20%. Thus, with a $160,000 loan, our monthly mortgage payment is going to be around 1.6 x $500 = $800/mo.
I can find my monthly cash flow by subtracting my mortgage payment by my monthly NOI:
- Monthly cash flow = $1,340 - $800 = $540/month.
A few of the things that aren’t accounted for on a monthly cash flow calculation, but that are still important are:
- Closing costs - I assume around 1.5% of the total loan amount.
- Rehab/make ready costs - This is extremely property dependent, so make sure to include it in your analysis, but it is being omitted here on purpose.
- Interest rate - Since we don’t have any idea what the specific interest rate will be on a given deal, I just use 5%. This will fluctuate as interest rates change, but given today’s market, 5% is reasonable.
So if we assume a $200,000 purchase price we can infer a few different things regarding the return on investment for this property:
- Cap rate: Based on our calculations, the purchase cap rate would be $16,600/$200,000 = 8.3%
- Closing costs: Assuming a loan amount of $160,000, our estimated closing costs would be $160,000 x 1.5% = $2,400.
- Cash on cash return: Assuming a 20% down payment, the cash on cash return would be ($540x12)/($40,000 + $2,400) = 15.2%
Where things get really interesting is when you start tinkering around with your assumptions for the purchase price and expenses. You can watch me edit those assumptions to see how they affect my return AND do a walk through of my property analysis example above on this video:
Making Offers
Once I’ve determined what I believe to be my final numbers, I’ll work backwards and reverse engineer my offer price on the property. Keep in mind - an asking price and an offer price are two vastly different things.
Sellers are more than welcome to ask anything they want for their property, and many people set their asking price based upon what they “feel” the property is worth. But remember, a property is worth only as much as someone is willing to pay for it.
I’ve offered well below the asking price on properties. Usually those types of offers get rejected, but it doesn’t cost anything to make an offer, so why not shoot for the moon?
Now I wouldn’t get in the habit of making ridiculous offers just to see what happens, since you’ll likely frustrate a lot of people. You should make offers based on logic and math and listen to what your numbers tell you.
If the property is listed at $100,000, but your numbers only support a purchase price of $80,000, make those offers all day. As long as you substantiate your offer price, no one can get frustrated with you.
Now I also wanted to touch on how to evaluate neighborhoods and specifics I look at when physically evaluating the actual property.

How to Evaluate The Neighborhood
For the neighborhood, I look at proximity to major employers and freeways/highways. I always want to know the answers to the following questions:
- Why are people living here?
- Since they’re likely living there for a job, how long does it take them to get to their job?
- Are people moving to the area or away from it? Why?
Once I’ve figured out that people are moving to the area because there are great employment opportunities, or education opportunities, or whatever the case may be for that specific neighborhood, I want to see how long getting to those opportunities would take someone.
For example, if someone has to spend one hour getting to and from their job, that’s much less attractive than a shorter commute. Purchasing properties that are centrally located and in areas with a growing population is a major plus for me.
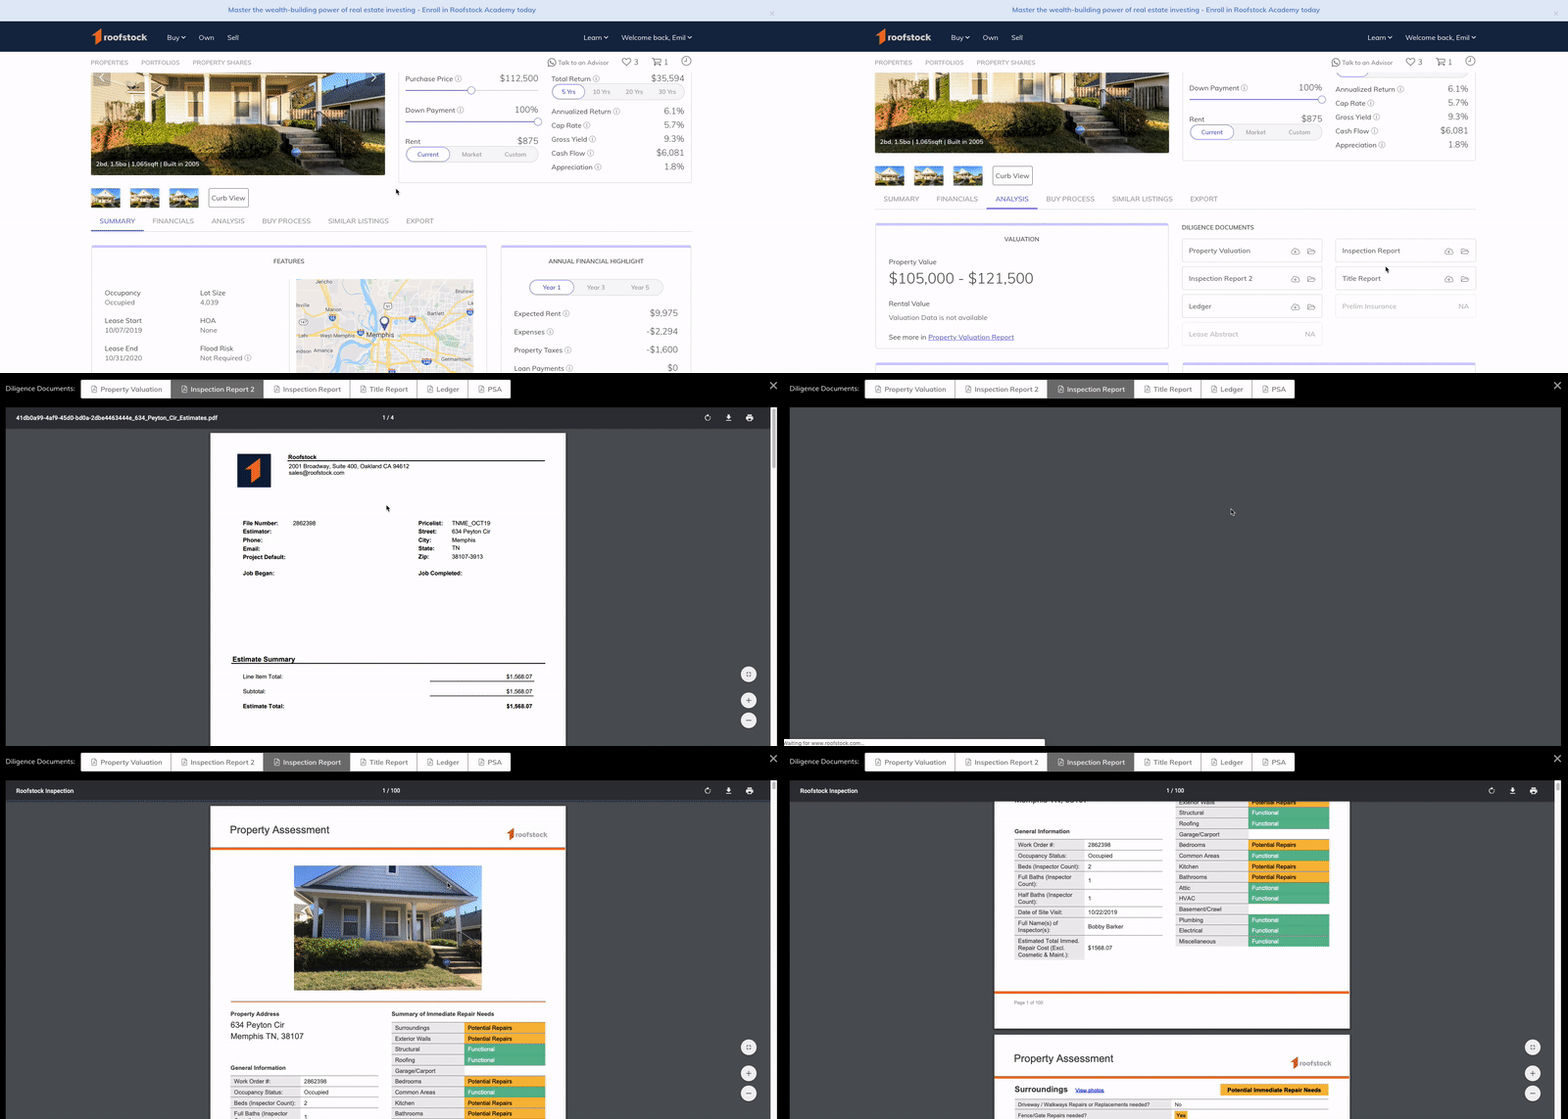
I usually look up this info with a quick Google search. In addition, Roofstock has already done an awesome job of this type of market research for investors. Take a look and see how they analyze neighborhoods.
You can also view the neighborhood score for any single-family property in the US using this handy tool.

How to Assess Physical Property Features
In addition to running the numbers and evaluating the neighborhood, it’s important to evaluate the physical property itself. The best way I know how to do this is with the assistance of a professional property inspector.
Inspectors are trained professionals who will inspect a property and highlight any deficiencies, safety concerns, or hazards. I can then use the report they produce to either continue to move forward with the transaction or walk away for free due to the inclusion of the “property inspection contingency” I utilize in all of my contracts.
Once I have a property inspection report, I will often reach out to local vendors and contractors to give me estimates of repair costs, so that I can renegotiate the purchase price based on the needed repairs.
One of the great things about Roofstock properties is that they often come with inspection reports already performed on the property. That means that anyone looking at a potential property should already have pretty good insights into the needed repairs. One of the coolest things about these inspection reports is that they come at no cost to the potential buyer.
