Indianapolis is ranked as the 4th best housing market positioned for growth in 2022. According to Realtor.com, home sales in the metro area are expected to increase by nearly 15% while prices are projected to grow by 5.5%.
One reason why the demand for homes in Indianapolis is so strong is due to the number of out-of-state real estate investors. As a recent report from HousingWire notes, remote real estate investors are putting Indianapolis at the top of their list of markets where property is still affordable and potential returns are higher.
Think about it for a minute. What’s the best compliment you can pay a real estate market? The answer is that doing your market research as an investor makes you want to live there. Indianapolis is one of those markets.
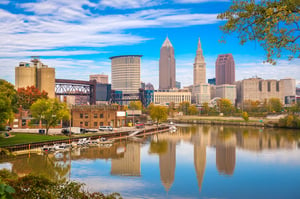
Indianapolis is ideally located and brimming with good jobs, entertainment, and friendly people, the so-called Circle City blends Big City buzz with small-town, midwestern charm. It’s also a city with incredible, cash-flowing properties and a high ceiling for expansion. Real estate forecasters praise its years of steady growth and high rental demand.
Have a look at some of our research into why Indianapolis is such a hot housing market, and why it could be home to your next rental property.
>>Explore Roofstock's Indianapolis properties here.
Population growth
Over the past 10 years, the population of Indianapolis has grown by more than 8%, while the suburban Indianapolis counties of Hamilton, Boone, and Hendricks have seen gains of more than 20% over the past decade.
Although population growth in the state may begin to slow, Indianapolis is forecast to be the state’s primary source of population growth over the next 30 years. According to Indiana University’s Kelley School of Business, the population of the 11-county Indianapolis region is predicted to grow by 26% in the coming decades.
Key population stats:
- Indianapolis is home to over 887,000 people in the city and more than 2.1 million residents in the metropolitan area.
- Population of Indianapolis grew by over 1.37% last year alone.
- Indianapolis is the capital of Indiana, the most populous city in the state, and the third most populous in the Midwest, right behind Chicago and Columbus.
- Counties in metropolitan Indianapolis include Marion, Boone, Brown, Hamilton, Hancock, Putnam, and Shelby.
- Largest cities in the Indianapolis region include Fishers, Carmel, Lawrence, and Greenwood.
- Population of the Indianapolis metropolitan area is projected to grow by 26% over the next 30 years.
- Per capita income in Indianapolis is $34,755 while median household income is $63,545.
Job market
Indianapolis is one of the eight non-coastal cities quickly becoming a hotbed for high technology growth. As WISH TV 8 reports, the in-bound migration of entrepreneurs to Indianapolis is helping to jump-start the economy and unlock private sector job creation.
Key employment stats:
- GDP of the Indianapolis-Carmel-Anderson, IN MSA is over $125 billion, according to the Federal Reserve Bank of St. Louis, and has grown by nearly 9% over the last 10 years.
- Employment growth in Indianapolis is 1.8% year-over-year with the metropolitan area home to over 1 million employees.
- Median household incomes in Indianapolis grew by 2.4% year-over-year while median property values increased by more than 8.6%.
- Unemployment rate in Indianapolis is currently 2.0% (as of April 2022) with the construction, manufacturing, financial activities, and leisure and hospitality sectors growing the fastest (BLS).
- Key industry sectors in Indianapolis include aerospace and aviation, advanced manufacturing, agriculture, cybersecurity, life sciences, and logistics and transportation.
- Largest employers in Indianapolis include IU Health University Hospital, Eli Lilly & Company, Indiana University, Roche Diagnostics Corporation, Ascension St. Vincent Hospital.
- Indianapolis has been named as one of the best cities for creating tech jobs, a best city for women in tech, and one of the best cities for renters in America.
- Indiana University-Purdue University Indianapolis, Ball State University, and Ivy Tech Community College are among the top universities and colleges in Indianapolis.
- Over 90% of the residents of Indianapolis are high school graduates or higher, while more than 35% hold a bachelor’s or advanced degree.
- Indianapolis’ transportation infrastructure includes four interstate highways, passenger and freight rail service, and two airports.
- Indianapolis International Airport (IND) serves nearly 10 million passengers annually and is home to the second largest FedEx Express hub in the world.
Real estate market
The Indianapolis real estate market was rated by Forbes as one of the top housing markets to watch in 2021. Back then, homes in the Indianapolis metro area were “flying off the shelf” with nearly two-thirds of the houses listed for sale going under contract just two weeks after hitting the market.
Fast forward to today, and the demand for homes in Indianapolis is still red hot. As Inside Indiana Business recently reported, single-family home sales remain “strong, fast moving and more expensive.” The median sales price of a single family home in Marion County (where Indianapolis is located) is up by 19% year over year (May 2021 vs May 2022), while the days on market is down by more than 12% to just 14 days, according to MIBOR.
Key market stats:
- Zillow Home Value Index (ZHVI) for Indianapolis is $220,967 through April 2022.
- Home values in Indianapolis increased by 19.8% over the last year.
- Over the last five years home values in Indianapolis increased by over 82%.
- Median sales price of a single-family home in Indianapolis is $250,000 based on the most recent report from the MIBOR Realtor Association (May 2022).
- Sales price per square foot of a single-family home in Indianapolis is $164.
- Average days on market is 14.
- Supply of homes for sale in Indianapolis is less than 1 month.
- Median sales prices for single-family homes in Indianapolis have increased by 19% year-over-year while the number of new listings has increased by 5%.
- Of the 105 neighborhoods in Indianapolis, Near Northside is the most expensive with a median listing price of $420,000, according to Realtor.com.
- Most affordable neighborhood in Indianapolis to buy a home is Near Westside where the median listing price of a home is $117,500.
Strong renters’ market
The Indianapolis housing market is one of the top real estate markets attracting out-of-state investors.
According to Real Wealth, Indianapolis is one of the best markets to buy rental property for cash flow and appreciation in 2022. The real estate market here is still relatively affordable, the demand for rental property is strong, and the metro area is growing.
Renter-occupied households in Indianapolis account for less than half of the occupied housing units, meaning there’s still plenty of potential growth left for rental real estate in Indianapolis.
Key market stats:
- Median rent in Indianapolis is $1,437 per month for a 3-bedroom home, based on the most recent research from Zumper (December 2021).
- Rents in Indianapolis have increased by 12% year-over-year.
- Renter-occupied households in Indianapolis account for 44% of the total occupied housing units in the metropolitan area.
- Most affordable neighborhoods in Indianapolis for renters include Stout Field, Park Fletcher, and West Indianapolis where average rents are $848 per month or less.
- Most expensive neighborhoods in Indianapolis for renters include North Central, Downtown Indianapolis, and Near Northside where rents can go as high as $2,600 per month.
Historic price changes & housing affordability
There are two important data sets real estate investors can use to gauge the potential demand for rental property. Historic prices changes can provide an idea of the potential appreciation in home prices, while the affordability of housing in a city can help indicate the future demand for rental property and rent growth.
Every month Freddie Mac publishes a house price index report (FMHPI) that updates the short- and long-term trends of home prices in all major markets in the U.S.
The most recent FMHPI from Freddie for the Indianapolis-Carmel-Anderson, IN MSA reveals:
- April 2017 HPI: 129.57
- April 2022 HPI: 218.75
- 5-year change in house prices: 68.8%
- One-year change in house prices: 18.9%
- Monthly change in home prices: 1.7%
Experienced real estate investors in Indianapolis also research housing affordability to help forecast the current and future demand for rental real estate. Affordability compares the amount of annual income needed to purchase a median-priced home in Indianapolis.
Business forecast and personal finance publication Kiplinger publishes a housing affordability report for the top 100 metropolitan areas in the U.S. The firm ranks affordability on a scale of 1 to 10, with 1 representing the most affordable markets and 10 the least affordable.
Kiplinger’s analysis of housing affordability in Indianapolis reports:
- Since the last real estate cycle market peak in May 2006, home prices in Indianapolis have increased by 28.2%.
- Since the last real estate cycle market bottom in March 2012, home prices in Indianapolis have increased by 91.3%.
- Indianapolis has an affordability index of 1 out of 10, meaning that while housing is affordable in the market, a high percentage of households in Indianapolis are still choosing to rent rather than own.
Quality of life
There are plenty of reasons why people, businesses, and real estate investors keep coming to Indianapolis. Housing prices are still affordable, the cost of living is low, and Indianapolis is well-known for being a city of doers and changemakers. As if that’s not enough, the State of Indiana could soon begin offering incentives for people to live here, with Indianapolis being first in line.
Key quality of life stats:
- Cost of living in Indianapolis is 13% lower than Atlanta and 21% less than Dallas, Texas.
- In fact, the cost of living in Indianapolis is 2% below the entire national average, according to Forbes.
- Indianapolis receives an overall “A-” grade from Niche.com with strong ratings for housing, cost of living, and nightlife.
- Metropolitan Indianapolis is also ranked as one of the top 10 housing markets positioned for growth in 2022.
- Indianapolis is among the best places to live and one of the best places to retire in the country, based on the most recent research from U.S. News & World Report.
- Some of the most popular neighborhoods in Indianapolis include Broad Ripple, Delaware Trails, Allisonville, and North Central.
- Top-rated education institutions in Indianapolis include Ball State University, Indiana University-Purdue University Indianapolis, and Ivy Tech Community College.
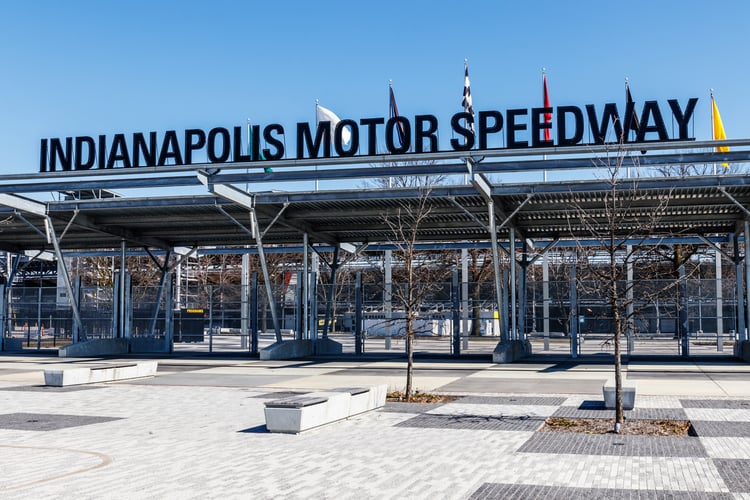
- The NFL Indianapolis Colts and the NBA Indiana Pacers are based in Indianapolis, while major sporting events include the Indianapolis 500 and Men’s and Women’s NCAA Basketball Tournaments.
- Indianapolis is home to countless cultural venues, including the Indianapolis Art Center and the Indianapolis Symphony Orchestra.
Get out the map
Where to begin your search? Roofstock has created a heatmap that color-codes the city based on our Neighborhood Rating, a dynamic algorithm that enables you to make informed investment decisions by measuring school district quality, home values, employment rates, income levels and other vital investment criteria.
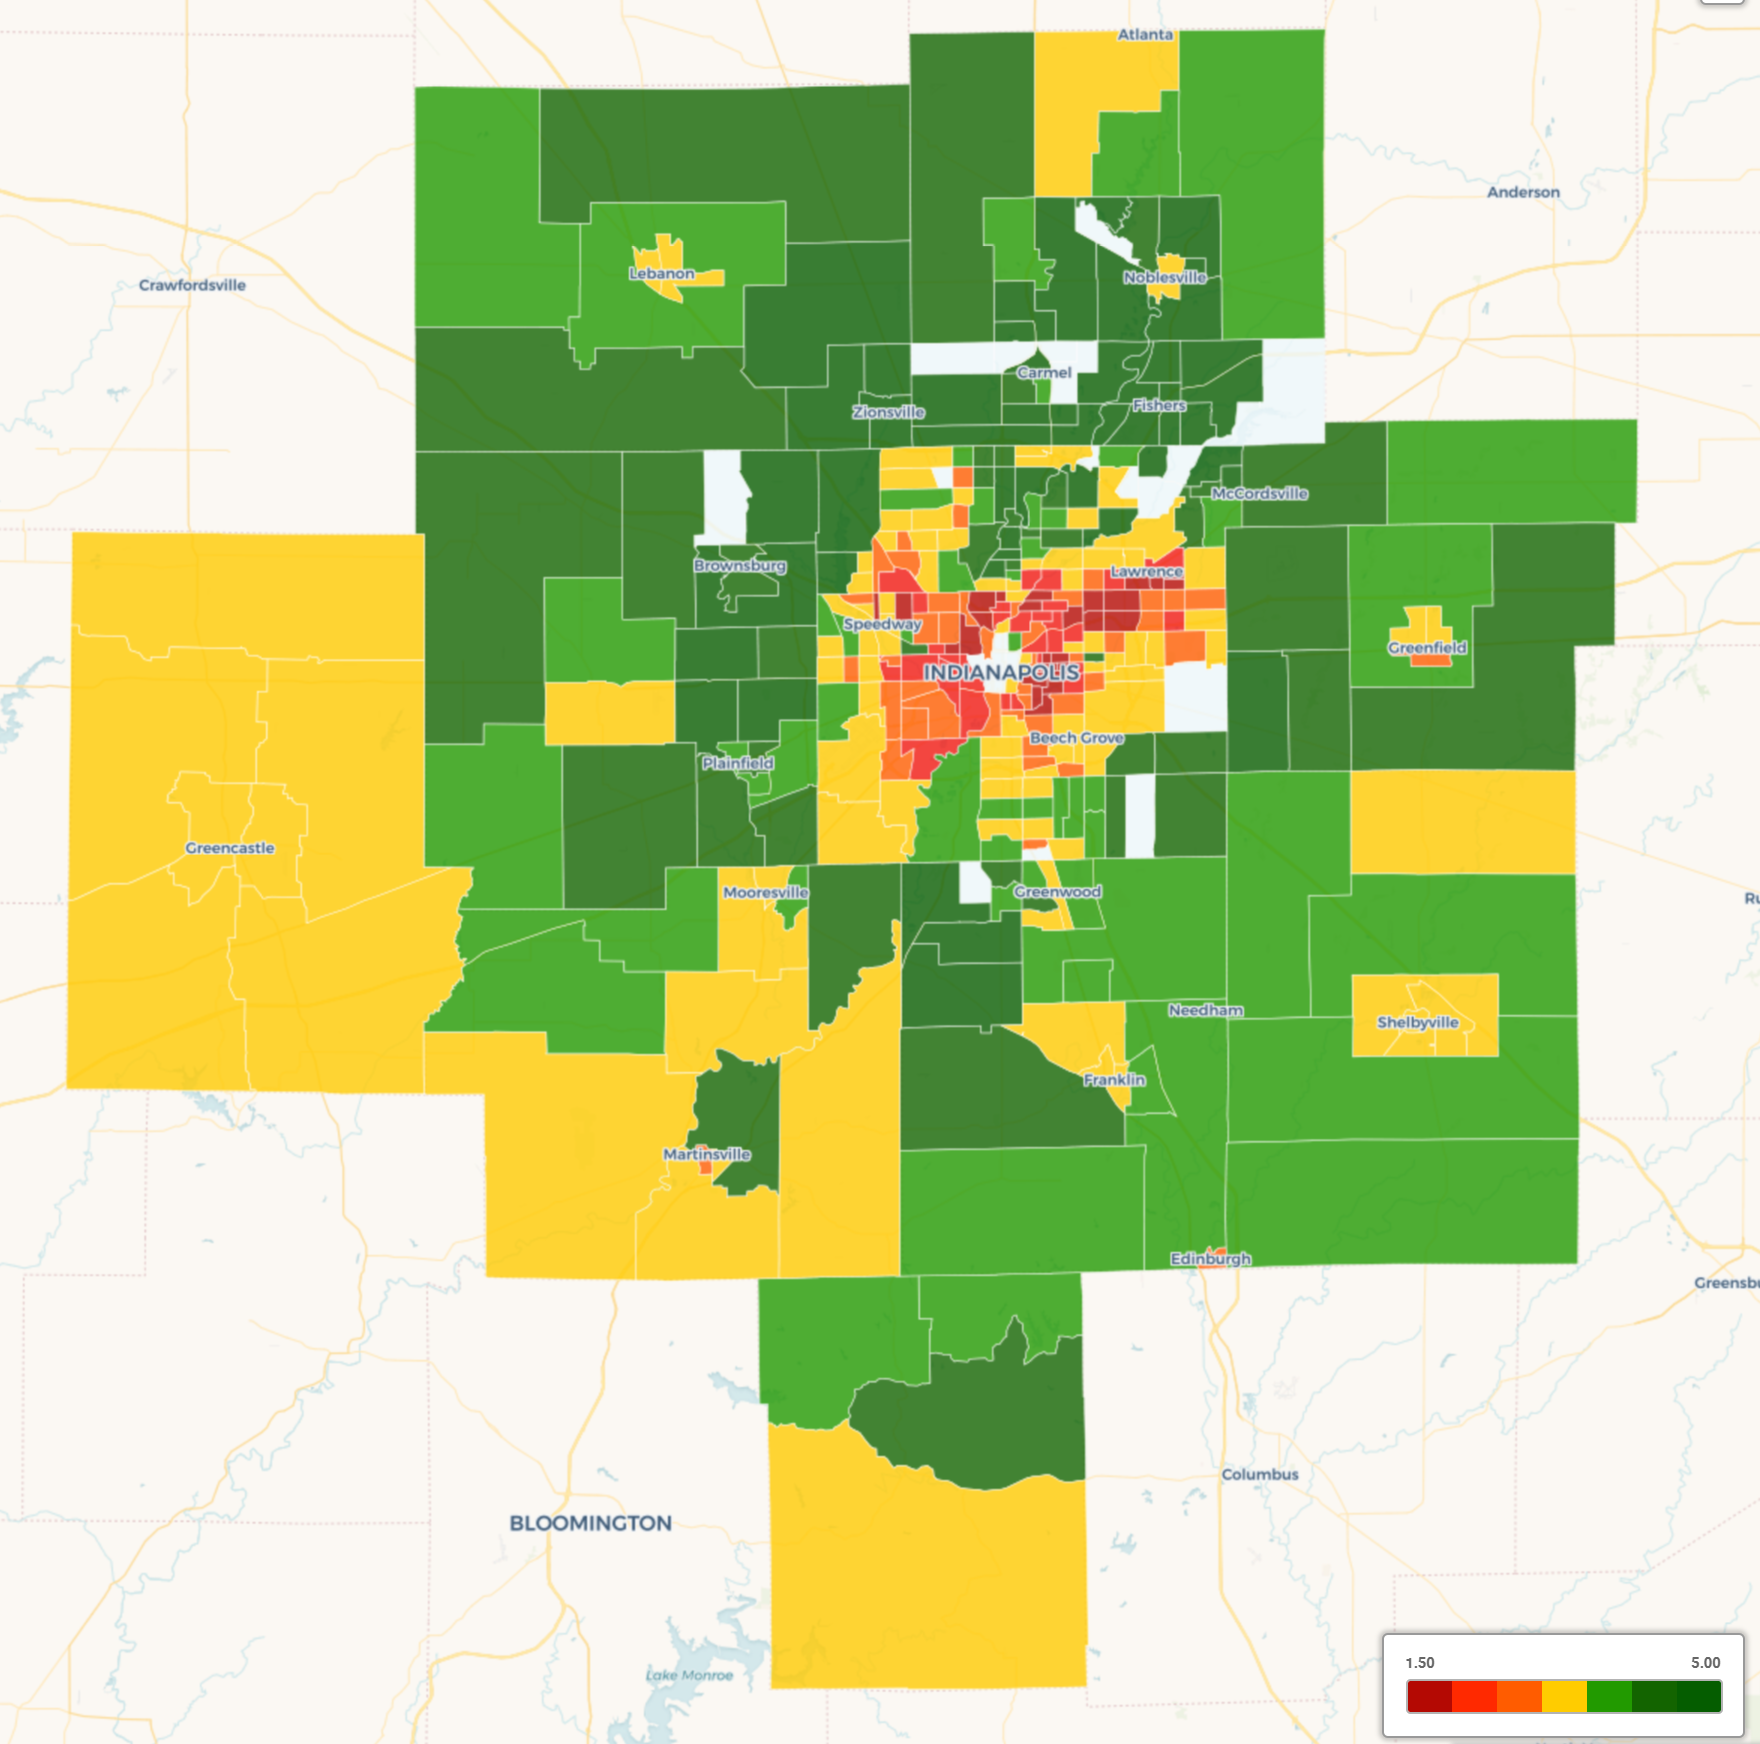
DARK GREEN: 4-5 star neighborhood
LIGHT GREEN: 3.5-4 star neighborhood
YELLOW: 2.5-3 star neighborhood
ORANGE: 2 star neighborhood
RED: 1 star neighborhood
Ready to invest in the Indianapolis real estate market? If you haven't already done so, create your free Roofstock account and set up alerts. We'll alert you when we have an Indy-area investment property that matches your search criteria.