Between 2019 and 2020, nearly 29 million Americans moved to new residences within the U.S, nearly 40% of which moved to different counties or states. Rising costs of living in some cities are driving residents to more affordable locales. According to the U.S. Census Bureau, while the total U.S. population grew by 1.3% over the past three years, some places with below-average living costs grew by more than 10%.
Geographic mobility within the U.S. has been declining since 2012. Between 1984 and 1985, over 20% of Americans moved residences. By 2020, that figure had dropped to less than 10%. Moving of all kinds—within the same county, to a different county within the same state, and to another state—is trending downwards. Reasons for this decline include an aging population, high housing and moving costs, and the rise of dual-earner households, according to the Joint Center for Housing Studies of Harvard University. The COVID-19 pandemic temporarily halted many moves, but the trends towards remote work may spur more residents to change locations, particularly to more affordable areas.
While the total U.S. population grew by 1.3%—or about 4.4 million people—from 2017 to 2020, some cities and states experienced dramatic population growth. At the state level, Idaho and Nevada grew at the highest rates from 2017 to 2020, at 6.2% and 5.6% respectively. Both relatively low population and affordable states, Idaho gained about 107,000 residents while Nevada gained just over 166,000 during the three-year period. On the other hand, many states with above-average living costs like Hawaii, New York, New Jersey, and California saw their populations decline or stagnate over the same period.
DID YOU KNOW?
Buying your first rental property isn’t easy, but it’s probably simpler than you think. Check out this 10-step plan for buying your first rental property.
To find the affordable metros with the most population growth in recent years, our team of researchers analyzed the latest population data from the U.S. Census Bureau and the latest cost-of-living data from the U.S. Bureau of Economic Analysis. The researchers ranked metro areas according to the percentage change in population from 2017 to 2020. Researchers also calculated the total change in population from 2017 to 2020 and the cost of living. To improve relevance, only metropolitan areas with at least 100,000 people were included. Additionally, locations with above-average living costs were filtered out.
Here are the nation’s affordable metros with the most population growth.
Large Affordable Metros With the Most Population Growth
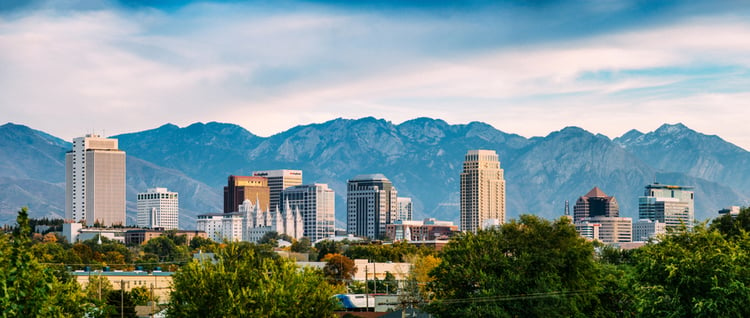
15. Salt Lake City, UT
- Percentage change in population (2017–2020): 2.9%
- Total change in population (2017–2020): 35,266
- Population 2020: 1,240,029
- Cost of living (compared to average): -1.4%

14. Indianapolis-Carmel-Anderson, IN
- Percentage change in population (2017–2020): 3.1%
- Total change in population (2017–2020): 62,046
- Population 2020: 2,091,019
- Cost of living (compared to average): -8.9%
RELATED
Here is what makes a particular real estate market attractive to successful investors, as well as where the top 10 markets are to invest in real estate in 2021.
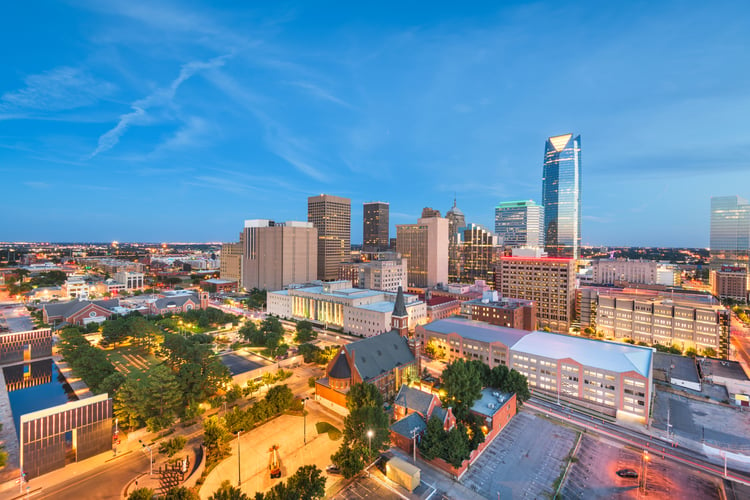
13. Oklahoma City, OK
- Percentage change in population (2017–2020): 3.1%
- Total change in population (2017–2020): 43,478
- Population 2020: 1,425,375
- Cost of living (compared to average): -10.2%
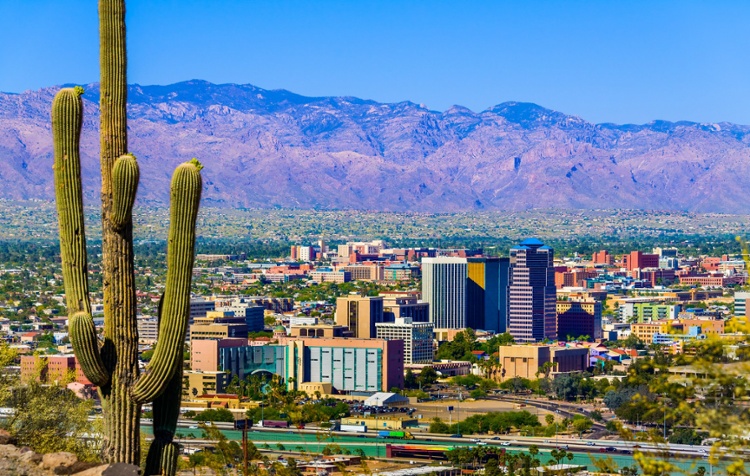
12. Tucson, AZ
- Percentage change in population (2017–2020): 3.3%
- Total change in population (2017–2020): 34,060
- Population 2020: 1,061,175
- Cost of living (compared to average): -6.9%

11. Atlanta-Sandy Springs-Alpharetta, GA
- Percentage change in population (2017–2020): 3.6%
- Total change in population (2017–2020): 210,999
- Population 2020: 6,087,762
- Cost of living (compared to average): -2.1%
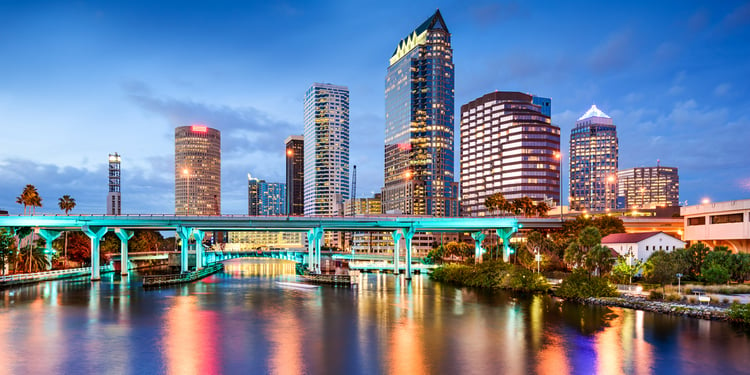
10. Tampa-St. Petersburg-Clearwater, FL
- Percentage change in population (2017–2020): 4.3%
- Total change in population (2017–2020): 133,685
- Population 2020: 3,243,963
- Cost of living (compared to average): -1.2%
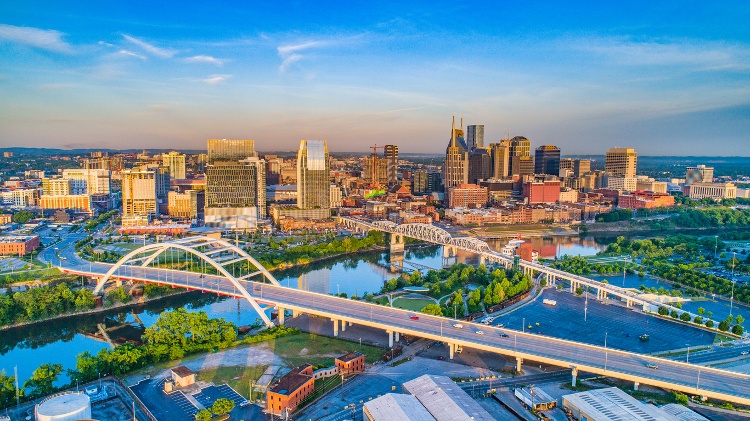
9. Nashville-Davidson--Murfreesboro--Franklin, TN
- Percentage change in population (2017–2020): 4.5%
- Total change in population (2017–2020): 84,783
- Population 2020: 1,961,232
- Cost of living (compared to average): -5.6%

8. Orlando-Kissimmee-Sanford, FL
- Percentage change in population (2017–2020): 4.7%
- Total change in population (2017–2020): 119,448
- Population 2020: 2,639,374
- Cost of living (compared to average): -1.0%

7. San Antonio-New Braunfels, TX
- Percentage change in population (2017–2020): 4.8%
- Total change in population (2017–2020): 119,129
- Population 2020: 2,590,732
- Cost of living (compared to average): -6.7%

6. Charlotte-Concord-Gastonia, NC-SC
- Percentage change in population (2017–2020): 5.2%
- Total change in population (2017–2020): 131,575
- Population 2020: 2,684,276
- Cost of living (compared to average): -5.6%

5. Jacksonville, FL
- Percentage change in population (2017–2020): 5.4%
- Total change in population (2017–2020): 80,998
- Population 2020: 1,587,892
- Cost of living (compared to average): -4.6%

4. Las Vegas-Henderson-Paradise, NV
- Percentage change in population (2017–2020): 6.1%
- Total change in population (2017–2020): 132,690
- Population 2020: 2,315,963
- Cost of living (compared to average): -3.1%

3. Phoenix-Mesa-Chandler, AZ
- Percentage change in population (2017–2020): 6.3%
- Total change in population (2017–2020): 299,192
- Population 2020: 5,059,909
- Cost of living (compared to average): -1.3%
TRENDING
Interested in investing in real estate? Here are 10 reasons why single-family rentals are a popular choice among many successful investors.
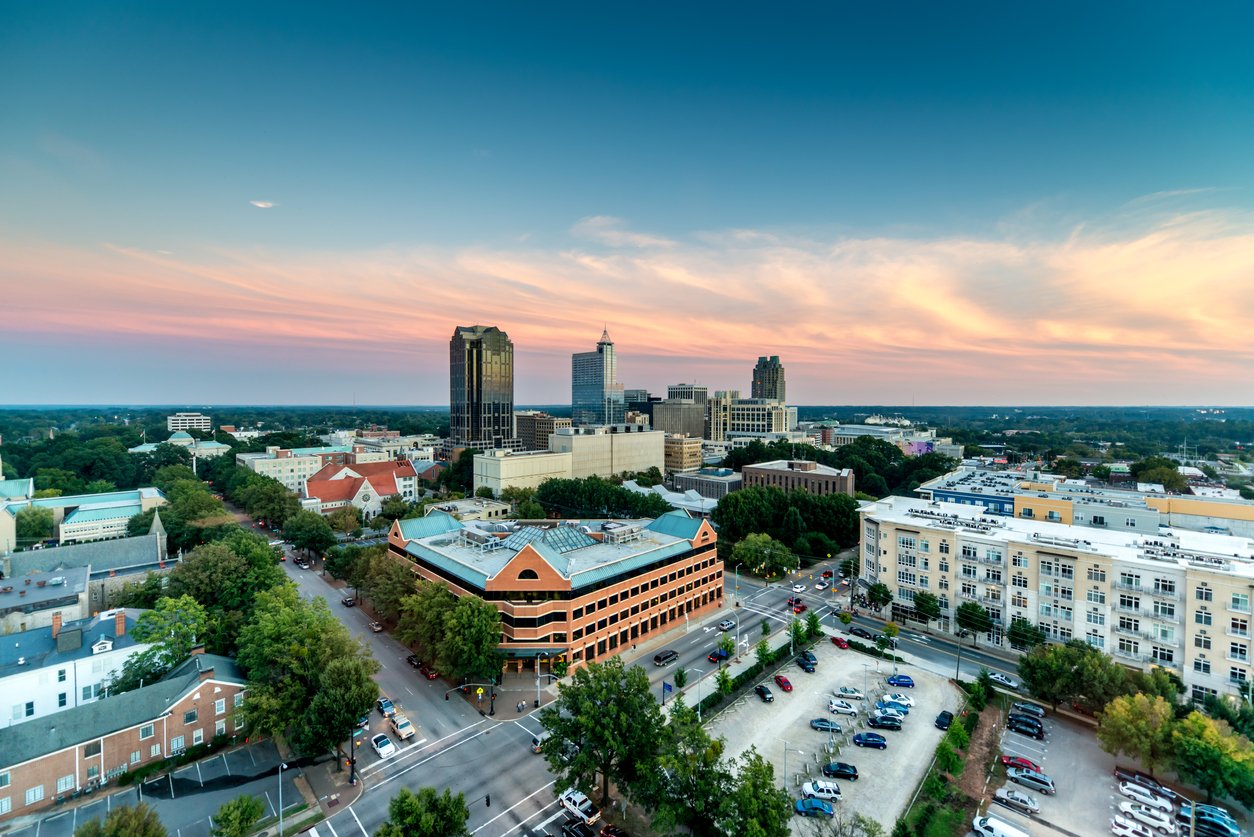
2. Raleigh-Cary, NC
- Percentage change in population (2017–2020): 6.4%
- Total change in population (2017–2020): 85,197
- Population 2020: 1,420,376
- Cost of living (compared to average): -3.9%
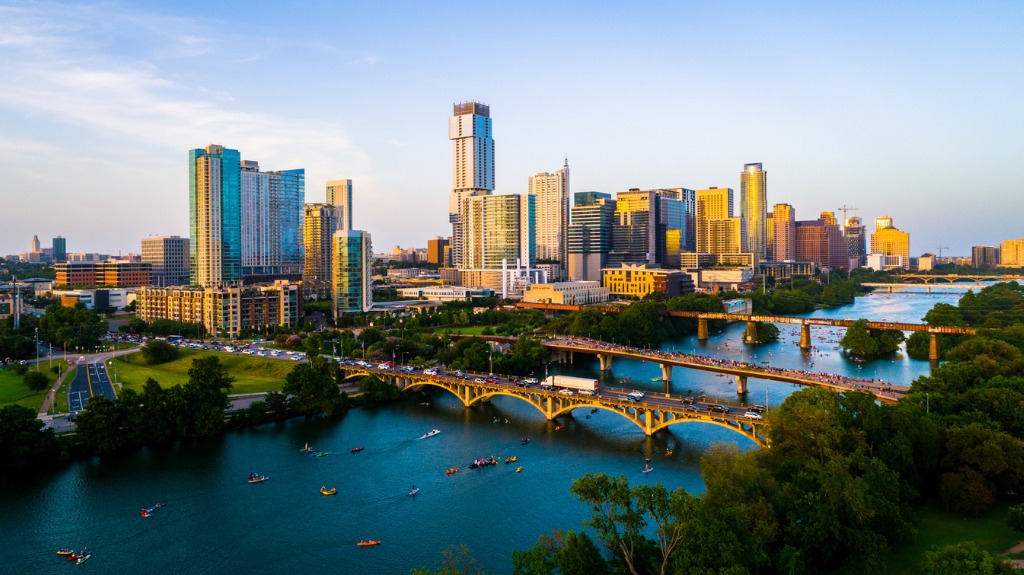
1. Austin-Round Rock-Georgetown, TX
- Percentage change in population (2017–2020): 8.5%
- Total change in population (2017–2020): 179,304
- Population 2020: 2,295,303
- Cost of living (compared to average): -0.7%
Detailed Findings & Methodology
To find the affordable locations with the most population growth, researchers at Roofstock analyzed the latest population data from the U.S. Census Bureau’s Population Estimates Program and cost-of-living data from the U.S. Bureau of Economic Analysis’s Regional Price Parity data. The researchers ranked metro areas according to the percentage change in population from 2017 to 2020. In the event of a tie, the metro with the larger total change in population from 2017 to 2020 was ranked higher. Only metros with costs of living less than the national average were included in the analysis.
To improve relevance, only metropolitan areas with at least 100,000 people were included in the analysis. Additionally, metro areas were grouped into the following cohorts based on population size:
- Small metros: 100,000–349,999
- Midsize metros: 350,000–999,999
- Large metros: 1,000,000 or more


