

Columbus is listed as one of the hottest housing markets by Realtor.com, based on market demand and the number of days a listing goes from active to under contract. The demand for homes in Columbus remains high due to relative affordability and in-migration.
There are a number of things that make the Columbus real estate market a great place for investors. Despite the increase in home prices, the market is “super affordable” compared to the average national listing prices for homes. The economy is diversified with major industries such as technology, finance, and education.
Located in Central Ohio, Columbus is the capital of the state and the second-largest city in the Midwest, just behind Chicago. Situated midway between Cleveland and Cincinnati, Columbus is a diverse city with funky summer festivals, die-hard sports fans where season tickets pass from one generation to the next, and is an incubator for fast food giants like Wendy’s and White Castle.
Read on to discover why Columbus ranks as one of the top real estate markets in the U.S.
>>Explore Roofstock's Columbus properties here.
Population growth
The historic population growth in Columbus has been “sturdy”, with the metro area gaining nearly 50 new people each and every day. According to the most recent survey by the U.S. Census Bureau, the population of Columbus surged by 15% over the past decade, about 7 times more than Ohio overall.
Strong population growth is one of the key market metrics real estate investors look for, because the more people there are the greater the demand for housing in Columbus is.
Key Population Stats:
- Columbus has a city population of nearly 906,000 residents, with more than 2.1 million people living in the metro area.
- The City of Columbus has more residents than San Francisco.
- Population growth in Columbus is 0.75% year-over-year while median household incomes grew by 4.93% over the same time period.
- Median household income in Columbus is $67,207 while per capita income is $36,285.
- Columbus’ location in the country is hard to beat: the city is within a one-day drive or one-hour flight to 41% of the U.S. population, 80% of the corporate headquarters in the U.S., 43% of U.S. manufacturing, and 29% of the Canadian population.
Job market
Over the last 10 years, the unemployment rate in Columbus has nosedived from about 9.5% in 2010 to just 4.0% in September 2021, according to the St. Louis Federal Reserve. According to the BLS, the current unemployment rate in Columbus is just 3.5% (Oct. 2021). Taking a look at the pie chart of employment by sector and it’s easy to understand why the job market in Columbus remains resilient.
The diverse economy based on education and government, banking and insurance, steel and logistics, and medical research and technology helped Columbus’ job market to grow by 3.58% while still maintaining a cost of living that’s 5% below the national average.
Key Employment Stats:
- GDP of Columbus is over $137 billion, an increase of over 50% in the last ten years.
- Employment growth in Columbus is 3.58% year-over-year.
- Five Fortune 500 companies are headquartered in Columbus: American Electric Power, Cardinal Health, L Brands, Nationwide, and Big Lots.
- Business Facilities ranks Columbus as one of the leading fintech cities in the country.
- Columbus has also been ranked as one of the 10 rising cities for startups, according to Forbes and one of the 20 best cities in the U.S. for startups, according to Commercial Cafe.
- Columbus is also home to some of the world’s largest businesses: private research and development foundation Battelle Memorial, chemical information clearinghouse Chemical Abstracts Service, and NetJets, with the largest fractional ownership of jet aircraft fleets in the world.
- High tech plays a major role in the Columbus economy: Smarts Asset names Columbus as the 5th best place to work in tech, Wallet Hub says Columbus is the 190th-best city for STEM (science, technology, engineering, and math) jobs, and both Fortune and Lending Tree have ranked Columbus the #1 city for tech jobs.
- Nearly 92% of the people in Columbus have a high school diploma or greater, while almost 38% hold an undergraduate or advanced degree.
- Interstate 70 runs east-west and Interstate 71 runs north-southwest through Columbus.
- John Glenn International Airport (named after Ohio native and astronaut John Glenn) is just a few minutes from Downtown Columbus and has seen record-setting years for both passenger and cargo traffic.
- Columbus is home to The Ohio State University, with one of the largest campuses in the U.S., and the Ohio State Fair, one of the largest state fairs in the country.
- NCAA’s Ohio State Buckeyes hold Big Ten Conference titles in both football and basketball, and the NHL’s Columbus Blue Jackets play at Nationwide Arena.

Real estate market
Columbus is one of the top 10 housing markets best positioned for growth in 2022, according to rankings by Realtor.com. The organization predicts sales will surge by 13.7% and prices will grow by 6.3% this year.
Top markets like Columbus are smaller and less crowded than major metros, with a limited housing supply combined with the jobs, services, good schools, and healthy economy helping to keep the demand for housing hot in Columbus.
Key Market Stats:
- Zillow Home Value Index (ZHVI) for Columbus is $241,472 through May 2022.
- Home values in Columbus increased by 17.3% over the last year.
- Over the past five years home values in Columbus have increased by more than 85%.
- Median listing price of a single-family home in Columbus is $240,000 based on the most recent report from Realtor.com (April 2022).
- Median listing price per square foot for a home in Columbus is $163.
- Days on market (median) is 35.
- Median sold price for a single-family home in Columbus is $206,000.
- Sold-to-list price ratio is 103.43%, which means that on average homes in Columbus are selling for a little bit more than the asking price.
- Months supply of inventory in Columbus is 0.8 (less than one month), an indication that Columbus is in a strong seller’s market, according to Columbus Realtors.
- Of the 220 neighborhoods in Columbus, German Village is the most expensive with a median listing price of $499,500.
- Most affordable neighborhood in Columbus for buying a home is South Linden where the median listing price is $129,000.
Strong renters’ market
Columbus is one of the best cities for renters, according to a recent report from WalletHub. The rental market in Columbus receives high rankings for activity in the marketplace, affordability of rental property, and overall quality of life. In fact, demand for rental property in Columbus is so strong that nearly half of the people in the metro area rent rather than own.
Key Market Stats:
- Median rent in Columbus is $1,650 per month for a 3-bedroom home, based on the most recent research from Zumper (June 2022).
- Rents in Columbus increased 6% year-over-year.
- Over the past 3 years, rent for a 3-bedroom place in Columbus has grown by about 22%.
- Renter-occupied housing units in Columbus make up 52% of the occupied housing units in the metropolitan area.
- Most affordable neighborhoods for renting include Arlington Park, North Rickenbacker, and Livingston Park North where rents average $750 per month or less.
- Most expensive areas of Columbus to rent include Downtown Columbus, Italian Village, and Short North where rents range between $2,448 and $3,600 per month.
Historic price changes & housing affordability
Tracking historic price changes and measuring the affordability of housing are two of the many techniques real estate investors use to decide if investing in a specific market makes sense.
Historic price changes help determine investment strategy, while housing affordability is one metric to help anticipate the potential demand for rental real estate in Columbus.
Each month Freddie Mac publishes its House Price Index (FMHPI) report on the change in home prices in every metropolitan area of the U.S. The most recent FMHPI for the Columbus, OH MSA reveals:
- April 2017 HPI: 139.0
- April 2022 HPI: 228.7
- 5-year change in home prices: 64.5%
- One-year change in home prices: 16.8%
- Monthly change in home prices: 1.6%
Using research from ATTOM Data Solutions, Kiplinger conducts a regular review of home prices and affordability in the top 100 housing markets in the U.S.:
- Since the last real estate cycle market peak in May 2006, home prices in Columbus have increased by 38.7%.
- Since the last real estate cycle market bottom in March 2012, home prices in Columbus have increased by 93.9%.
- Columbus has an affordability index of 4 out of 10, meaning the metro area is one of the more affordable places to own a home in the U.S.
Quality of life
Columbus ranks as the 28th-best place for business and careers, in the top 74 for job growth, and the top 55 for education. Job growth is strong, unemployment is low, and the cost of living is 5% below the national average in the U.S.
Key Quality of Life Stats:
- Every July, usually on the 4th, Columbus holds its annual Doo Dah Parade to promote satire, liberty, and lunacy.
- Columbus is great for active lifestyles, having invested $20 million to develop a growing system of bike and fitness trails that connect the suburbs and river trails to downtown's $44 million riverfront park system restoration.
-
Shopping, entertainment and fine dining include the Arena District, Easton Town Center, Polaris Fashion Place and Tuttle Mall.
Get out the map
Where to begin your search? Roofstock has created a heat map of Columbus based on our Neighborhood Rating, a dynamic algorithm that enables you to make informed investment decisions by measuring school district quality, home values, employment rates, income levels and other vital investment criteria.
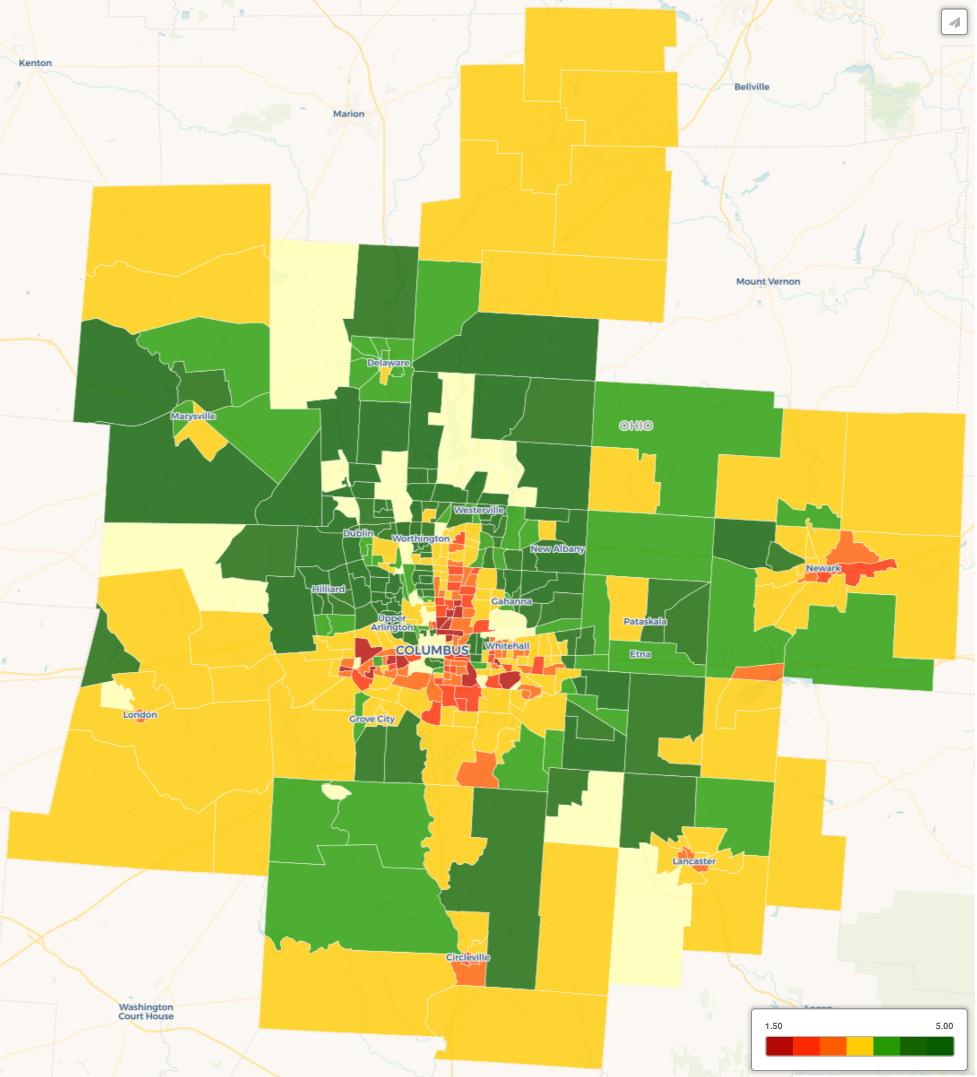
DARK GREEN: 4-5 star neighborhood
LIGHT GREEN: 3.5-4 star neighborhood
YELLOW: 2.5-3 star neighborhood
ORANGE: 2 star neighborhood
RED: 1 star neighborhood
Ready to invest in the Columbus market? If you haven't already done so, create your free Roofstock account and set up alerts. We'll notify you when we have a Columbus investment property that matches your search criteria.