
Kansas City has been named as one of the top 10 housing markets for buyers to consider. Looking at the recent performance statistics for the real estate market in Kansas City, it’s easy to understand why.
Active listings are down by 7% year-over-year, while average sales prices have increased by almost 10% over the last 12 months. As homes become more expensive and harder to find, many households in Kansas City are choosing to rent rather than own.
In fact, growth and demand are two words that have been used to describe the real estate market in Kansas City, according to one local economist. Today, it seems like Kansas City is growing everywhere you look: downtown, in the first-ring suburbs, and in the outlying areas.
Kansas City, Missouri (nicknamed “KC” for short) is the largest city in the state and spans the Missouri and Kansas state lines. Located where the Missouri and Kansas Rivers meet, KC is known for its jazz music, pro sports teams, and delicious Kansas City-style barbecue. The economy is diverse, and the government is business friendly, two of the many things that help keep the real estate market in Kansas City growing strong and steady.
>>Explore Roofstock's Kansas City properties here.
Population growth
The population of Kansas City has hit the highest level ever, and suburban counties are growing even faster. According to KCUR 89.3, more than 500,000 people call Kansas City home while Platte and Clay counties north and northwest of KC have seen population growth of nearly 20% over the past 10 years.
Key Population Stats:
- With nearly 2.4 million residents, Greater Kansas City is the 36th most populated metropolitan area in the U.S.
- Population of the Kansas City metro area has grown by 0.1% year-over-year, with the city of Kansas City seeing its population increase by 10.5% over the last decade, according to the most recent census.
- Kansas City raised its population by more than 48,000 people in 10 years.
- Suburbs to the north of Kansas City are among the fastest-growing, with Platte County growing by nearly 20% and the population of Clay County increasing by 14%.
- The population of the nine-county Kansas City metro area is about the same as Austin, Las Vegas, and Pittsburgh, based on data from the Mid-America Research Council.
- Over the 20 years, Kansas City is expected to add another 400,000 residents by 2040.
Job market
Job postings in Kansas City are at record highs, even though the region has regained over 154,000 jobs lost during the pandemic. According to the BLS , unemployment in Kansas City is down to just 2.4% (as of April 2022). The U.S. Bureau of Labor Statistics reports that some of the employment sectors in Kansas City showing the fastest signs of growth include construction, trade and transportation, leisure and hospitality, and professional and business services.
Kansas City is a major transportation hub and is also home to high-growth tech sectors like IT and finance. Going forward, it’s likely that employment in the management and business, sales and office, and production and transportation sectors in Kansas City will continue to match or outpace U.S. averages.
Key Employment Stats:
- GDP of Kansas City is over $142.5 billion, according to the Federal Reserve Bank of St. Louis, and has grown by nearly 40% over the last 10 years.
- Kansas City, Missouri accounts for 56% of the metro area workforce with employment growing by 2.8% over the last 12 months.
- Largest employment sectors in Kansas City are education and health services, professional and business services, retail, trade, and manufacturing and construction.
- Major companies with headquarters in Kansas City include American Century Investments, Commerce Bancshares, Dairy Farmers of America, Garmin, Hallmark Cards, Interstate Bakeries (maker of Twinkies and Wonder Bread), Sprint Nextel, and one of the largest freight shipping companies in the world, YRC Worldwide.
- Ford and General Motors both have large manufacturing and assembly facilities in the Kansas City metro area, and Sanofi-Aventis has one of the largest drug manufacturing plants in the U.S. in south Kansas City.
- Largest federal government employers in Kansas City include the Department of Defense, Internal Revenue Service, Social Services Administration, and the Department of Veterans Affairs. The Kansas City Federal Reserve Bank is also headquartered here.
- Companies in Kansas City that recently created new jobs include Meta, RLE International Group USA, Scorpion Biological Services, VetNova, and Zoom.
- Major universities in the Kansas City metro area include University of Kansas, University of Missouri-Kansas City, University of Central Missouri, and Park University.
- 92.5% of people in the metro area are high school graduates or higher, while 37.5% hold a bachelor’s degree or advanced degree.
- Four major Interstate highways (I-70, I-49, I-35, and I-29) pass through Kansas City.
- Major cities less than 800 miles from KC include Atlanta, Chicago, Dallas, Denver, Houston, and Minneapolis.
- Freight railroads serving Kansas City include Burlington Northern Santa Fe and Union Pacific.
- Shipping channels in Kansas City have 41 dock and terminal facilities in the metro area.
- Kansas City International Airport (KCI) is served by major airlines including Air Canada, American, Delta, Southwest, and United.
Real estate market
The housing market in Kansas City is “red hot.” According to a recent report from KCTV 5, there are three rules that apply to the home buying game in the metro area: Cash is king, asking prices are just starting points, and you snooze, you lose.
According to the most recent information from the Kansas City Regional Association of Realtors (KCAR, May 2022), homes are going under contract after being on the market 19 days, and are selling for nearly 4% more than the original listing price. Rising construction and materials costs help to make resale homes an attractive option, which further increases the demand for single-family homes in Kansas City.
Key Market Stats:
- Zillow Home Value Index (ZHVI) for Kansas City is $228,174 (as of May 2022).
- Home values in Kansas City have increased by 17.8% over the last year.
- Over the past 5 years home values in Kansas City have grown by over 74%.
- Median list price of a single-family home in Kansas City is $235,000 based on the most recent report from Realtor.com (April 2022).
- Median listing price per square foot for a home in Kansas City is $143.
- Of the 220 neighborhoods in Kansas City, KCI-2nd Creek is the most expensive with a median listing price of $518,000.
- Most affordable neighborhood for home buyers in Kansas City is Blue Hills where the median price of a home is $124,900.
Attractive Renters’ Market
Kansas City is ranked as one of the top markets for renters by WalletHub. The report measures key criteria such as activity in the rental market, affordability, and quality of life rating. A low supply of housing inventory may also be helping to drive the demand for single-family rentals in Kansas City, as the Kansas City Regional Association of Realtors (KCRAR) recently reported.
Key Market Stats:
- Median rent in Kansas City is $1,445 per month for a 3-bedroom home, based on the most recent research from Zumper (as of December 2021).
- Rents in Kansas City have increased 18% year-over-year.
- Over the past 3 years, rents for a 3-bedroom place in Kansas City have increased by more than 28%.
- Renter-occupied households in Kansas City make up 45% of the total occupied housing units.
- Neighborhoods in Kansas City with the lowest rents include Washington Weatley, Palestine East, and South Town Fork Creek where rents all average $650 per month.
- The most expensive neighborhoods to rent in Kansas City include Crossroads, River Market, and The Downtown Loop where rents range between $2,775 and $4,205 per month.
Historic price changes & housing affordability
Each month Freddie Mac publishes its House Price Index report (FMHPI) that allows rental property investors to track both short- and long-term historical price trends.
The most recent FMHPI from Freddie for home price trends in metropolitan Kansas City reveals:
- April 2017 HPI: 141.38
- April 2022 HPI: 229.64
- 5-year change in home prices: 62.4%
- One-year change in home prices: 15.6%
- Monthly change in home prices: 1.6%
Affordability is another tool real estate investors can use to help forecast the current and future demand for rental property in Kansas City. According to the annual report from Kiplinger that tracks the affordability of housing in the top 100 U.S. markets:
- Since the last real estate cycle market peak in May 2006, home prices in Kansas City have increased by 5.4%.
- Since the last real estate cycle market bottom in March 2012, home prices in Kansas City have increased by more than 82%.
- Kansas City has an affordability index of 2 out of 10, meaning the metro area is one of the more affordable places to own a home in the U.S.
Quality of life
Cost of living has a major effect on the quality of life in an area. According to the cost of living calculator from NerdWallet, the cost of living in Kansas City is more than 40% less than big expensive urban areas such as San Francisco, New York City, and Seattle.
Key Quality of Life Stats:
- Forbes ranks Kansas City as one of the best places for business and careers, job growth, and education in the U.S. with a cost of living 3% below the national average.
- Total per capita tax burden in Kansas is about 10% less than the national average.
- Kansas City is one of the least-congested metro areas in the U.S. and has one of the shortest commuting times.
- The RideKC Bike system has 42 locations across Kansas City, and the city plans to build 1,000 miles of bike lanes and pedestrian walks over the next 20 years.
- KC Streetcar serves the Central Business District, and connects the River Market, Crown Center, Union Station, and Crossroads Art Districts.
- Kansas City has more boulevards than any city in the world except Paris, earning it the nickname “Paris of the Plains”.
- The NFL Kansas City Chiefs, MLB Kansas City Royals, and MLS Sporting Kansas City soccer teams give residents of Kansas City and real estate investors plenty to cheer about.
Get out the map
Where to begin your search? Roofstock created a heat map of Kansas City based on our Neighborhood Rating, a dynamic algorithm that enables you to make informed investment decisions by measuring school district quality, home values, employment rates, income levels and other vital investment criteria.
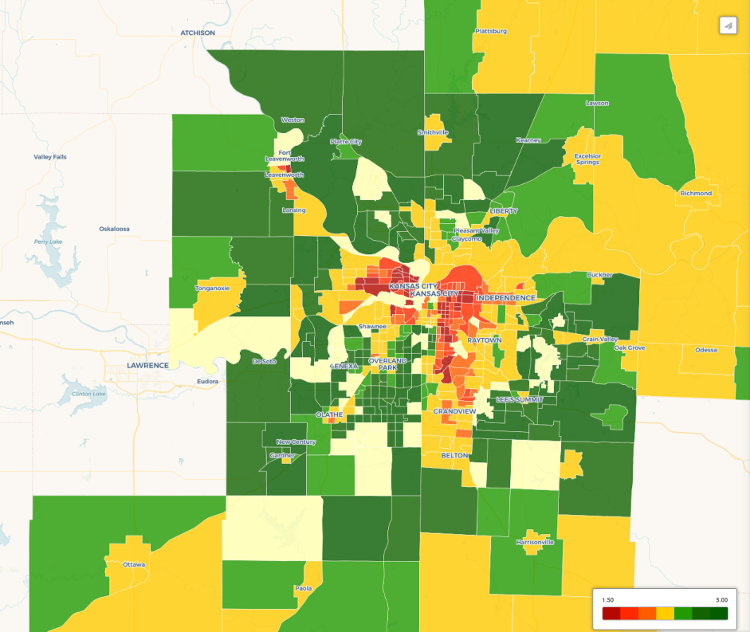
DARK GREEN: 4-5 star neighborhood
LIGHT GREEN: 3.5-4 star neighborhood
YELLOW: 2.5-3 star neighborhood
ORANGE: 2 star neighborhood
RED: 1 star neighborhood
Ready to invest in the Kansas City housing market? If you haven't already done so, create your free Roofstock account and set up alerts. We'll notify you when we have a Kansas City investment property that matches your search criteria.