Real estate investors are purchasing more homes in Phoenix than in any of the other top 30 markets in the U.S., due to the metro area’s double-digit rent growth and high price-to-rent ratio.1
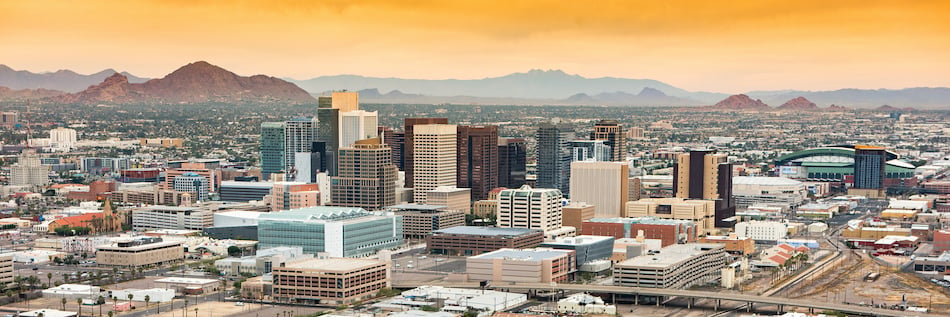
Nicknamed the Valley of the Sun, Phoenix is the capital of Arizona and the most populous city in the state.
Home to over 4.8 million residents in the metropolitan area, the demand for housing in Phoenix is driven by various factors such as a lower cost of living and plenty of nice weather with 300 days of sunshine each year.
From bustling urban areas to the suburban communities, there’s plenty to do in Phoenix. The city is home to all 4 major professional sports leagues, world-class dining resorts, and dozens of museums and performing arts venues.
Population growth
No city grew faster than Phoenix over the past 10 years. The population of the Phoenix metro area grew by 603,451 people over the last decade, at a rate of 15.8%.2
In-bound migration, retirees, middle-class families from California and other states looking for a place where housing is more affordable, and tech companies are all finding Phoenix the perfect place to be.
Key population stats:
- Phoenix is home to over 1.6 million residents and nearly 4.4 million people in the Phoenix-Mesa-Scottsdale metropolitan area.
- The population in Phoenix grew by 15.8% over the past decade and by 1.7% year-over-year.3
- Phoenix is the capital of Arizona, the most populous city in the state, and the fifth most populous city in the U.S.
- The population of Greater Phoenix is projected to reach 5.64 million by 2029.4
- Major cities in the Phoenix metropolitan area and Maricopa County (where Phoenix is located) include Mesa, Chandler, Glendale, Scottsdale, Gilbert, Tempe, and Peoria.
- More than 40 million people are within a 1-day drive of Phoenix, including residents of nearby metro areas such as Los Angeles, San Diego, Las Vegas, and Albuquerque.
- The per capita income in the Phoenix metro area is $34,378 and the median household income is $67,068.

Job market
Phoenix has topped the nation for job growth, with small business employment leading the way, growing by nearly 6% year-over-year. In fact, Arizona is projected to see annual job growth of 1.6% through the end of the decade.5,6
Key employment stats:
- The GDP for the Phoenix-Mesa-Scottsdale MSA is more than $281 billion, according to the Federal Reserve Bank of St. Louis, and has grown by more than 57% over the past decade.7
- The unemployment rate in Phoenix is 2.7% as of April 2022.8
- The job sectors showing the fastest signs of growth in Phoenix include leisure and hospitality, professional and business services, education and health services, and trade and transportation.
- Target industry sectors that are thriving in Greater Phoenix include advanced manufacturing, aerospace and defense, cybersecurity, e-commerce and logistics, finance and insurance, healthcare and biomedical, and startups.9
- Top major employers and businesses in metropolitan Phoenix are the State of Arizona, Wal-Mart Stores, Banner Health, the City of Phoenix, Wells Fargo, Bank of America, and Maricopa County.
- Metropolitan Phoenix is home to more than 40 universities and educational institutions, such as Arizona State University, Northern Arizona University, University of Arizona, and Maricopa Community Colleges.
- About 88% of the residents of Phoenix are high school graduates or higher, while more than 32% hold a bachelor’s degree or an advanced degree.
- The transportation infrastructure in Phoenix includes 2 Interstate highways, and freight rail lines with access to the West Coast, Southwest, and Mexico.
- Sky Harbor International Airport has more than 1,200 flights per day, reaching 142 domestic and international locations.
Real estate market
Phoenix is leading the nation in home price increases, with prices up 29.3% year-over-year. Part of the reason for the surge in demand for homes in Phoenix may be due to buyers moving from urban apartments to suburban homes, along with the strong demand from investors for rental property in Phoenix.10,11
Key market stats:
- The Zillow Home Value Index for Phoenix is $383,924 as of October 31, 2021.12
- Home values in Phoenix increased by 29.6% over the past year and have grown by more than 204% since 2016.
- The median listing price of a home for sale in Phoenix is $475,000 based on the most recent report from Realtor.com (April 2022).13
- The median listing price per square foot of a home in Phoenix is $293.
- The median sold home price in Phoenix is $461,000.
- The sale-to-list price ratio is 101.61%, meaning that homes in Phoenix are selling for slightly above the asking price on average.
- Phoenix is ranked as a seller’s market by Realtor.com, because there are more people looking to buy than there are homes available.
- Of the 38 neighborhoods in Phoenix, Arcadia is the most expensive with a median listing price of $1.7 million.
- The most affordable neighborhood in Phoenix is Central City South, where the median listing price of a home is $324,500.
Strong renters’ market
Investors in Phoenix are snapping up homes, attracted by the market’s high price-to-rent ratio of 25.9 and double-digit increase in rent prices. In fact, real estate investors in Phoenix are taking away more inventory than in any other of the top 30 metropolitan areas.14
Key market stats:
- The median rent for a 3-bedroom home in Phoenix is $2,175 per month, according to Zumper (as of December 2021).15
- Rent prices in Phoenix have increased by 8% year-over-year.
- The price-to-rent ratio of 25.9 in Phoenix indicates that the market is a better environment for renters versus homebuyers.
- Single-family homes in Phoenix make up 70% of the housing units, one of the reasons why a house is an attractive rental option.16
- Renter-occupied households account for 36% of the occupied housing units in Phoenix, based on recent research by RENTCafé.17
- About 28% of the population in Phoenix is between the ages of 20 and 39, a key demographic group of rental property investors.
Historic price changes & housing affordability
Two of the most commonly-used data sets real estate investors use when analyzing markets to buy rental property are the Home Price Index (HPI) and the Housing Affordability Index (HAI). The HPI measures the change in housing prices over time, while the HAI monitors the median cost of housing relative to median household income.
The House Price Index from Freddie Mac (FMHPI) reports the typical price inflation for houses in the U.S. The most recent HPI for Phoenix from Freddie Mac reveals that seasonally adjusted home prices in the Phoenix metro area have increased by over 212% over the past 5 years:18
- April 2016 HPI: 173.09
- April 2022 HPI: 367.14
- 5-year change in home prices: 212.1%
- 1-year change in home prices: 29.8%
The HAI – or Housing Affordability Index - compares the median price of a resale home to the median family income in a market. Real estate markets with an HAI above 100 tend to be more affordable to buy, while cities with an HAI below 100 tend to be more favorable for renting.
According to the most recent data, the HAI for Phoenix is 119. This means that buying a median priced home is still affordable for residents with a median household income.19
Quality of life
The strong job market, lower cost of living, and abundant sunshine help rank Phoenix as the 67th best place to live. Factors such net migration and desirability helped the Valley of the Sun to rank as one of the best places to live and retire from U.S. News & World Report.20
Key quality of life stats:
- Phoenix receives an overall score of 6.2 out of 10 from U.S. News, and is ranked as the 67th best place to live and the 140th best place to retire.21
- Niche.com gives Phoenix an overall niche grade of A-, with high scores for public schools and nightlife.
- The cost of living in Phoenix is 3% below the national average, with health care, goods and services, and housing more affordable compared to the rest of the country.22
- Outdoor attractions in Phoenix include the Phoenix Mountains Preserve, Tempe Town Lake, and the Desert Botanical Garden.
- Pro sports fans will find plenty to cheer for in Phoenix, from the NBA’s Phoenix Suns to the NFL’s Arizona Cardinals and more.
- Mayo Clinic Phoenix, Banner Boswell Medical Center, and St. Joseph’s Hospital and Medical Center are among the top hospitals in the Phoenix metro area.23
Get out the map
Where to begin your search? Roofstock created a heat map of Phoenix based on our Neighborhood Rating, a dynamic algorithm that enables you to make informed investment decisions by measuring school district quality, home values, employment rates, income levels and other vital investment criteria.
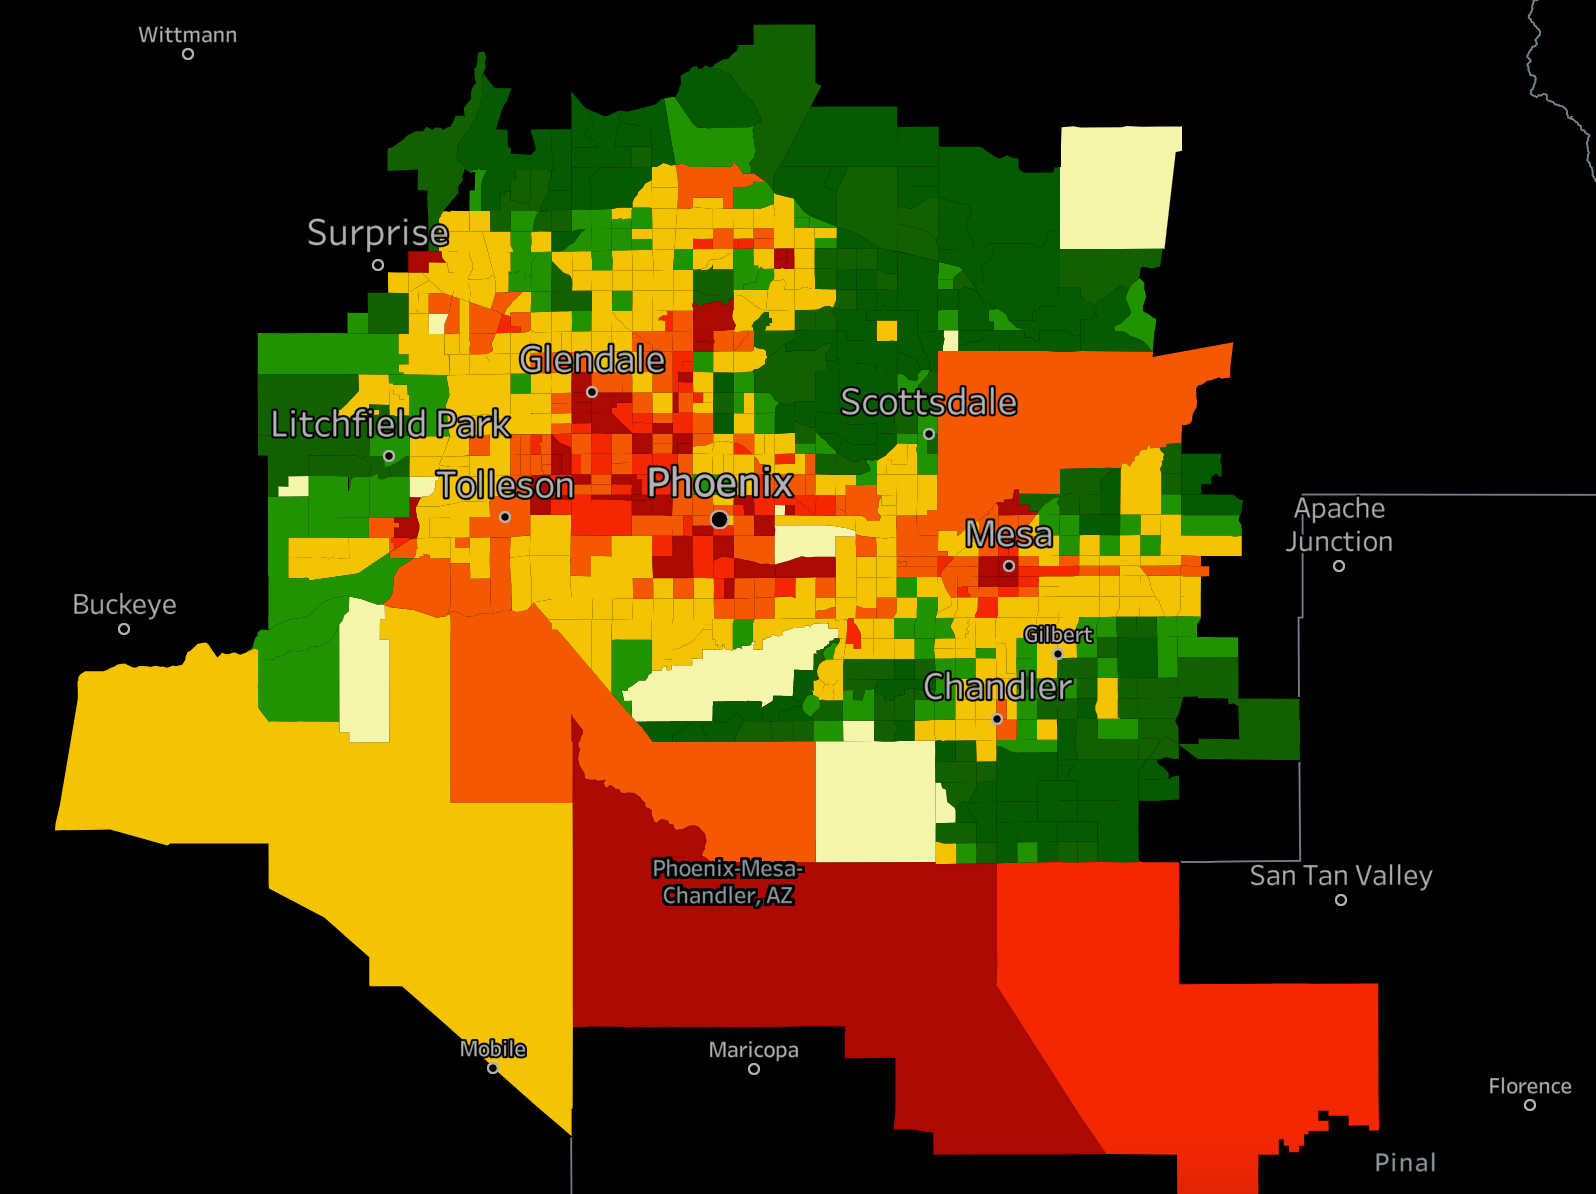
DARK GREEN: 4-5 star neighborhood
LIGHT GREEN: 3.5-4 star neighborhood
YELLOW: 2.5-3 star neighborhood
ORANGE: 2 star neighborhood
RED: 1 star neighborhood
Ready to invest in the Phoenix housing market? If you haven't already done so, create your free Roofstock account and set up alerts. We'll notify you when we have a Phoenix investment property that matches your search criteria.
References
- https://azbigmedia.com/real-estate/residential-real-estate/phoenix-no-1-housing-market-negatively-impacted-by-investors/
- https://www.nytimes.com/2021/08/12/us/phoenix-census-fastest-growing-city.html
- https://datausa.io/profile/geo/phoenix-mesa-scottsdale-az
- https://www.gpec.org/doing-business-here/demographics-workforce/
- https://www.bizjournals.com/phoenix/news/2021/08/04/arizona-tops-small-business-growth-in-july.html
- https://www.bizjournals.com/phoenix/news/2021/05/07/arizona-job-growth-to-outpace-nation.html
- https://fred.stlouisfed.org/series/NGMP38060
- https://www.bls.gov/eag/eag.az_phoenix_msa.htm
- https://www.gpec.org/industry-analysis/
- https://azbigmedia.com/real-estate/residential-real-estate/phoenix-no-1-housing-market-negatively-impacted-by-investors/
- https://azbigmedia.com/real-estate/residential-real-estate/phoenix-leads-nation-with-29-3-year-over-year-home-price-increase/
- https://www.zillow.com/phoenix-az/home-values/,
- https://www.realtor.com/realestateandhomes-search/Phoenix_AZ/overview
- https://azbigmedia.com/real-estate/residential-real-estate/phoenix-no-1-housing-market-negatively-impacted-by-investors/
- https://www.zumper.com/rent-research/phoenix-az
- https://censusreporter.org/profiles/31000US38060-phoenix-mesa-chandler-az-metro-area/
- https://www.rentcafe.com/average-rent-market-trends/us/az/phoenix/
- http://www.freddiemac.com/research/indices/house-price-index.page
- https://arizona.hometownlocator.com/az/maricopa/phoenix.cfm
- https://www.abc15.com/news/region-phoenix-metro/phoenix-improves-in-latest-u-s-news-best-places-to-live-rankings
- https://realestate.usnews.com/places/arizona/phoenix
- https://www.areavibes.com/phoenix-az/cost-of-living/
- https://health.usnews.com/best-hospitals/area/phoenix-az