Two years ago, real estate experts in South Bend were optimistic the market would remain strong and robust for the foreseeable future, according to the South Bend Tribune.
Fast forward to today, and it turns out the experts were absolutely right. With less than 4 weeks of inventory on the market, median sales prices for homes in South Bend have increased by over 21% as fewer new listings come to market.
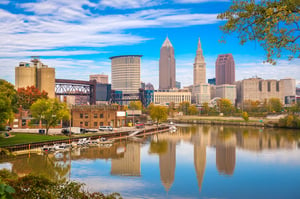
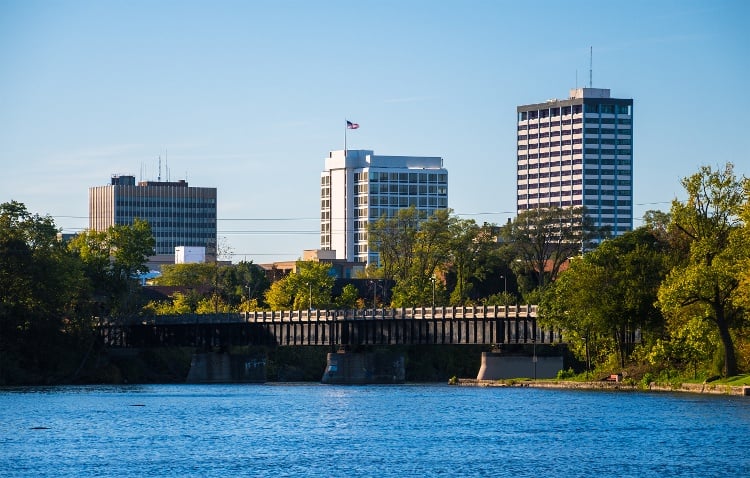
South Bend, Indiana is located in St. Joseph County along the banks of the St. Joseph River. The metro area is home to Notre Dame University and is the cultural and economic hub of Northern Indiana.
The city is business-friendly and boasts a diverse economy powered by the education, healthcare, high tech, and service industry sectors. Metropolitan South Bend ranks as one of the best places for business and careers with a cost of living well below the national average.
Keep reading to learn about what makes South Bend’s real estate market attractive in 2022.
>>Explore Roofstock's South Bend properties here.
Population growth
South Bend has seen the largest population growth since the 1950s, growing by 2,285 people over the past 10 years. According to the City of South Bend, this is the first time in 100 years that the city grew at a faster rate than the population of St. Joseph County where South Bend is located.
Key Population Stats:
- City of South Bend is home to about 103,453 residents with more than 324,500 people living in the South Bend–Mishawaka metropolitan area.
- Population of the South Bend metro area has grown by about 0.37% year-over-year.
- Between now and 2050 population growth is projected to be 0.9%.
- South Bend–Mishawaka is the 4th largest city in Indiana.
- St. Joseph County in Indiana and Cass County in Michigan make up the South Bend MSA.
Job market
The economy in South Bend-Mishawaka continues to recover, with the unemployment rate about half of what it was just a few months ago. The industry mix in South Bend is diverse, with the leisure and hospitality, construction, and education and health services sectors helping to drive annual employment growth above 5%.
Key Employment Stats:
- GDP of South Bend–Mishawaka is over $15.5 billion, according to the Federal Reserve Bank of St. Louis, and has grown by over 33% over the past decade.
- Employment growth in metropolitan South Bend is 3.0% year-over-year through April 2022.
- Unemployment rate in South Bend is 2.5% as of April 2022.
- Industry sectors with the largest number of employees include trade and transportation, private education and health services, government, manufacturing, and professional business services.
- Major employers in South Bend include University of Notre Dame, supermarket operator Msm Holdco, Saint Joseph Regional Medical Center and Beacon Medical Group, military and commercial vehicle manufacturer AM General, Air Wisconsin Airlines, and Honeywell International.
- Ignition Park and Innovation Park make up Indiana’s first two-site state-certified technology park for manufacturing and support services in the high tech industry.
- Institutions of higher learning in the South Bend area include Notre Dame University, Saint Mary’s College, Holy Cross College, and Indiana University South Bend.
- Nearly 90% of the residents in metro South Bend have a high school diploma or higher, while over 29% hold a bachelor’s degree or advanced degree.
- Interstate highways I-80, I-90, and the Indiana Toll Road connect South Bend to state and national highway systems.
- Port of Indiana – Burns Harbor is 50 miles from South Bend and within a one-day drive of 70% of the U.S. market.
- Freight railway carriers in South Bend include CSX and Norfolk Southern, while passenger railway service is provided by Amtrak and South Shore Railroad.
- South Bend International Airport (SBN) provides non-stop service to 13 cities including New York, Charlotte, Orlando, Atlanta, Dallas/Fort Worth, Phoenix, and Las Vegas.
Real estate market
Real estate in South Bend is more desirable in terms of affordability, local amenities, and more space for working from home. However, as one local real estate expert notes, the problem is there simply aren’t enough homes for sale in South Bend to satisfy the growing demand.
According to the April 2022 report from South Bend Area Realtors, the inventory of homes for sale is down nearly 12% year-over-year, while median sales prices have increased by almost 21%.
Key Market Stats:
- Zillow Home Value Index in South Bend is $162,354 (as of April 2022).
- Homes values in South Bend have increased 24.4% over the last year.
- Over the past five years home values in South Bend have grown by over 82%.
- Median listing price of a home in South Bend is $159,900 based on the most recent report from Realtor.com (April 2022).
- Median per square foot listing price of a house in South Bend is $110.
- Median sales price of a home in South Bend-St. Joseph County is $195,000, according to the Indiana Association of Realtors (as of April 2022).
- Of the 32 neighborhoods in South Bend, the most expensive neighborhood is Sunnymeade with a median listing price of $239,900.
- Most affordable neighborhood in South Bend is LaSalle Area with a median listing price of $55,000.

Attractive renters’ market
The demand for rental property in South Bend is red hot, with rent prices climbing and many homes receiving several applicants.
According to a recent report from the South Bend Tribune, everything from affordable housing to high-end rentals are in demand. As one local real estate expert notes, “High demand has already pushed up average rent prices by about 10% this year, and they could continue to go up as more people continue to enter the market.”
Key Market Stats:
- Average rent in South Bend is $1,151 per month based on the most recent research from RentCafe (February 2022).
- Rents have increased in South Bend by 10% year-over-year.
- Renter-occupied homes represent 43% of the total occupied housing units in the South Bend metropolitan area.
- Most affordable neighborhoods in South Bend for renters include Lasalle Park, Reo Avenue, and St. Casimir.
- Northeast South Bend, River Point, and Wooded Estates are the most expensive areas in South Bend for renters where rents can go as high as $1,700 per month.
- Some of the most popular neighborhoods for renters in South Bend are Navarre, Wooded Estates, Council Oak, and Howard Park-East Bank.
Historic price changes & housing affordability
The monthly house price index report from Freddie Mac is a free online data source real estate investors can use to analyze the historic changes in home prices in markets throughout the U.S. Analyzing price changes is one way of forecasting potential property appreciation over both the short- and long-term.
The most recent Freddie Mac House Price Index (FMHPI) report for the South Bend-Mishawaka MSA shows:
- April 2017 HPI: 128.03
- April 2022 HPI: 207.35
- 5-year change in home prices: 61.9%
- One-year change in home prices: 16.4%
- Monthly change in home prices: 1.6%
A Housing Affordability Index, or HAI, is a data set real estate investors can review to help determine the amount of demand for rental property in a given market.
As the National Association of Realtors explains, the HAI compares the median income a family needs to qualify for a median priced single-family resale home, assuming they use a conventional mortgage with 20% down. The NAR uses 100 as the baseline index. So, the greater the HAI is above 100 the more income a family has to buy a home.
According to Home Town Locator, the HAI for the South Bend-Mishawaka MSA was 176 as of July 2021, the most recent year available. This means that the median family has less than 2 times the income needed to purchase a median priced, single-family resale home in South Bend, which may be one reason why 43% of the households in the metropolitan area are occupied by renters.
Quality of life
South Bend is where natural beauty meets metropolitan style, according to the area’s Regional Partnership. The “Michiana Region” along the coast of Lake Michigan is home to vast beaches, orchards, breweries, performing arts centers, and vibrant downtowns.
Key Quality of Life Stats:
- Forbes ranks South Bend, Indiana as one of the best places for business and careers and #26 in the country for the cost of doing business.
- Cost of living is 12% below the national average.
- South Bend is about 1 ½ hours by car to Downtown Chicago, and a 2 ½ drive to Indianapolis.
- Niche.com ranks South Bend as the 6th-best place to live in Indiana, with high ratings for housing, nightlife, and cost of living.
- Average commute time in Sound Bend is under 20 minutes each way.
- Festivals like the South Bend Jazz Festival and Riverlights Music Festival attract local, regional, and national artists each year.
- South Bend is home to dozens of museums, galleries, and must-visit places such as the South Bend Museum of Art, Studebaker National Museum, and South Bend Chocolate Company factory.
- University of Notre Dame is located in suburban South Bend.
- Memorial Hospital of South Bend is ranked as the 4th-best hospital in Indiana by U.S. News & World Report.
Get out the map
Where to begin your search? Roofstock created a heat map of South Bend based on our Neighborhood Rating, a dynamic algorithm that enables you to make informed investment decisions by measuring school district quality, home values, employment rates, income levels and other vital investment criteria.
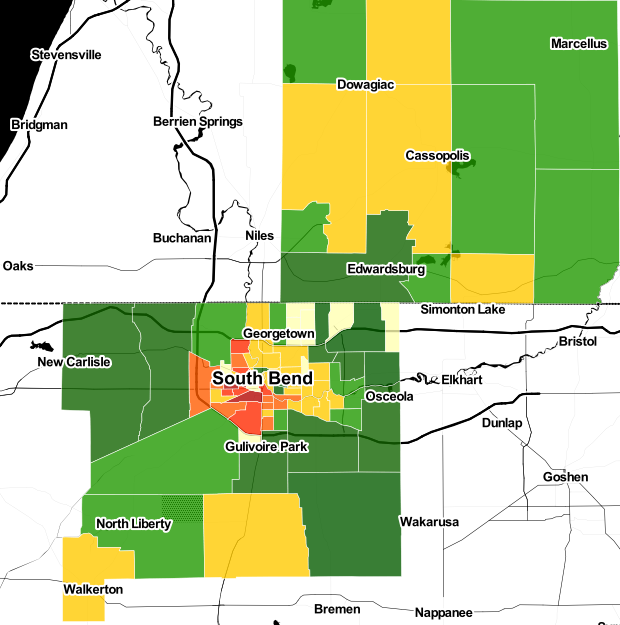
DARK GREEN: 4-5 star neighborhood
LIGHT GREEN: 3.5-4 star neighborhood
YELLOW: 2.5-3 star neighborhood
ORANGE: 2 star neighborhood
RED: 1 star neighborhood
Ready to invest in the South Bend housing market? If you haven't already done so, create your free Roofstock account and set up alerts. We'll notify you when we have a South Bend investment property that matches your search criteria.