
The COVID-19 pandemic has precipitated a mass exodus of people from dense, expensive cities to less crowded, affordable areas. A recent survey conducted by The Harris Poll found that 39 percent of urban Americans are considering moving to a less crowded location as a result of the pandemic.
This shift in attitude follows a long period of urbanization that began during the Industrial Revolution, and will have important ramifications for both home buyers and real estate investors in the years ahead.
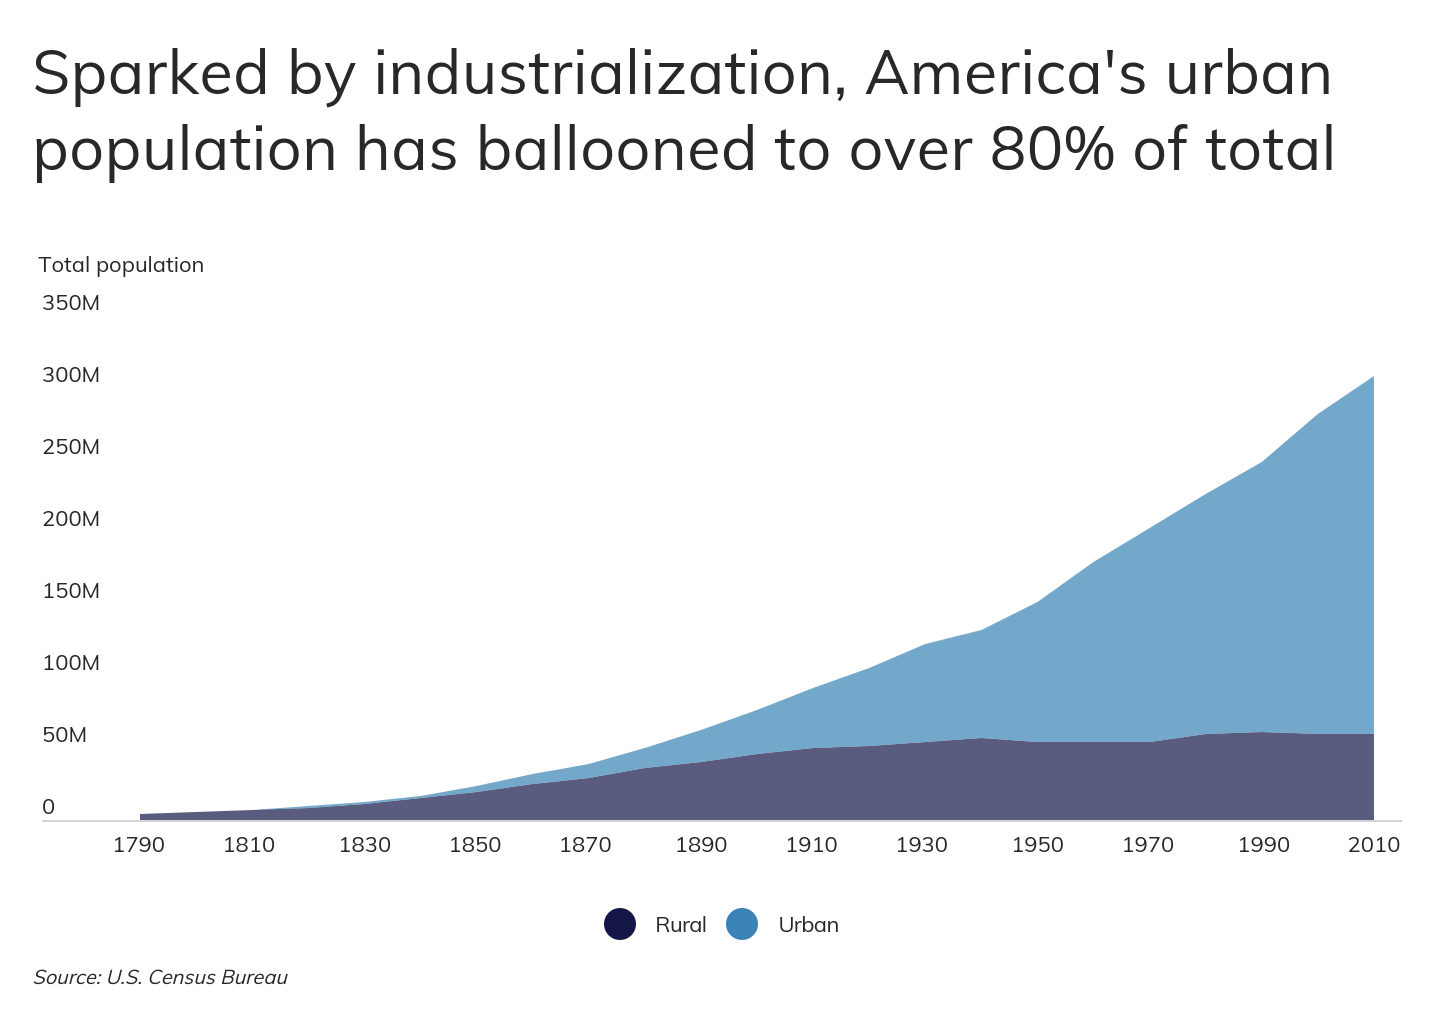
Despite most Americans living in high-density areas, the overall population density in the U.S. is relatively low, at under 100 people per square mile. In fact, only about 5 percent of U.S. counties have a population density that exceeds 1,000 people per square mile.
Most of these high-density counties are located in coastal states such as Virginia, New Jersey, New York, and California. Low-density areas are scattered throughout the country, with the lowest population densities observed in the North Central and Mountain regions.

While rural living might be attractive for some, many Americans are simply looking for less crowded alternatives to some of the most densely populated areas like New York City (27,954 per square mile), San Francisco (18,828 per square mile), and Boston (14,396 per square mile). For reference, the median population density of America’s 324 largest cities with over 100,000 residents is just 3,419 per square mile, about 80 percent less crowded than New York City.
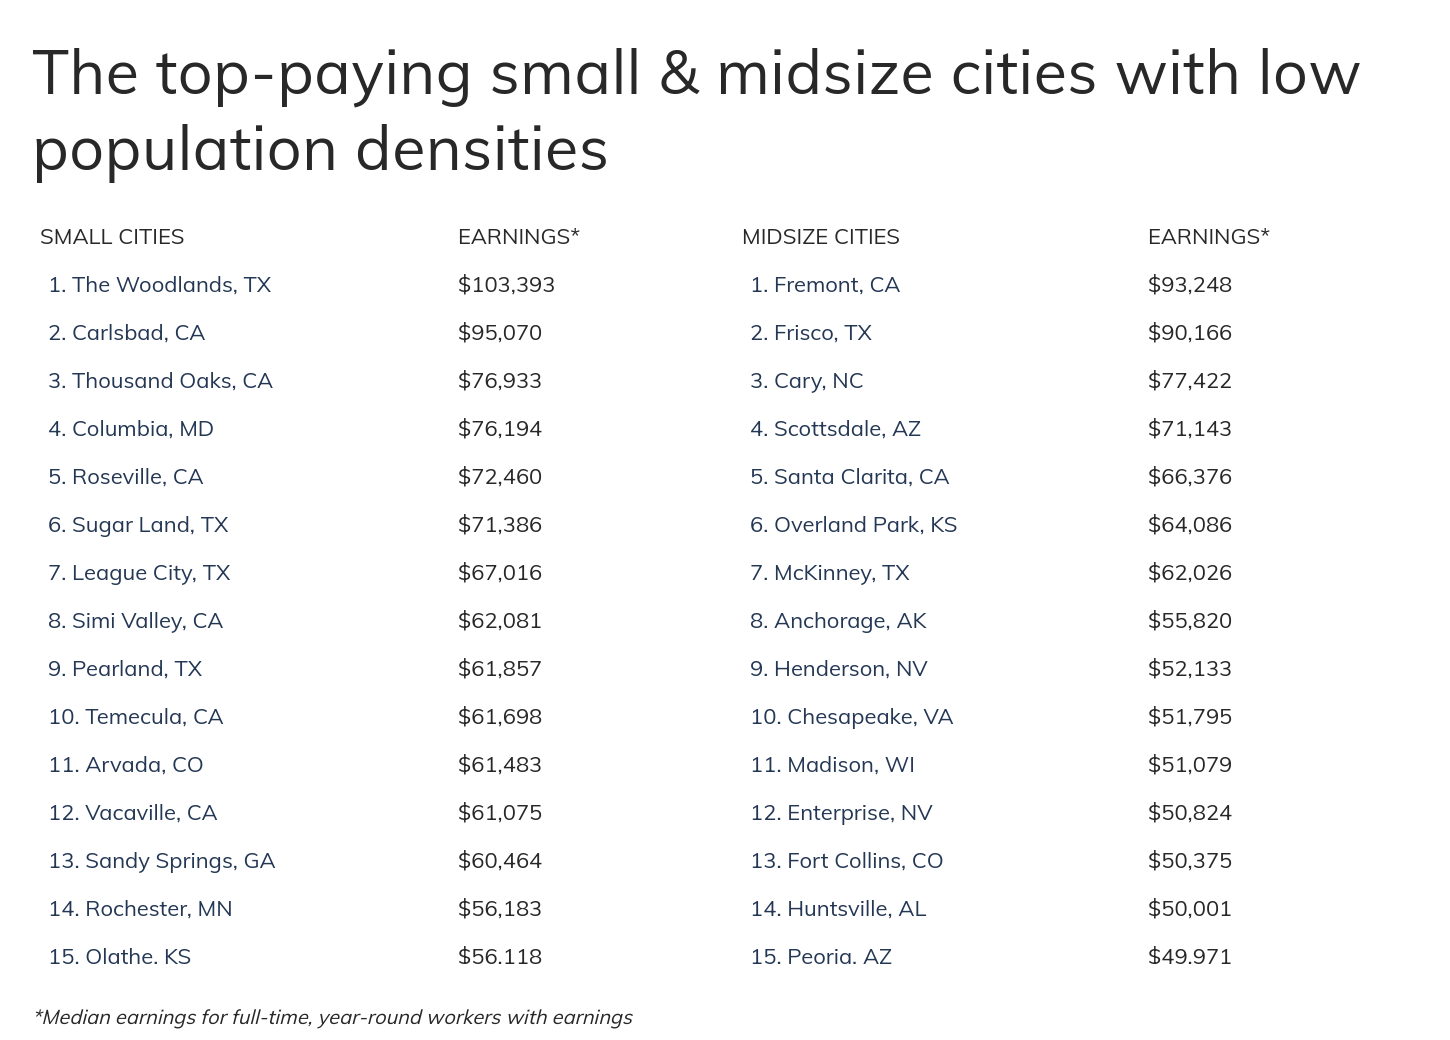
For families seeking a less crowded place for health and safety reasons, but also wanting to maintain a comparable salary, there are several locations to consider, especially in the South and the Midwest. These low-density areas with high-income families also represent potential buy opportunities for real estate investors coping with America’s waning appetite for high-density living.
To find which low-density cities pay the best, we analyzed data from the U.S. Census Bureau for cities with over 100,000 residents. The researchers first identified cities with population densities that fell below the median of 3,419 people per square mile. Then the researchers ranked the remaining cities by their respective median annual earnings for full-time workers. In the event of a tie, the city with the higher median earnings for all workers was ranked higher.
To improve relevance, cities were further grouped into the following cohorts based on population size: small (100,000–149,999), midsize (150,000-349,999), and large (350,000 or more). Here are the best-paying, low-density cities in the U.S.
Top-paying large cities with low population densities

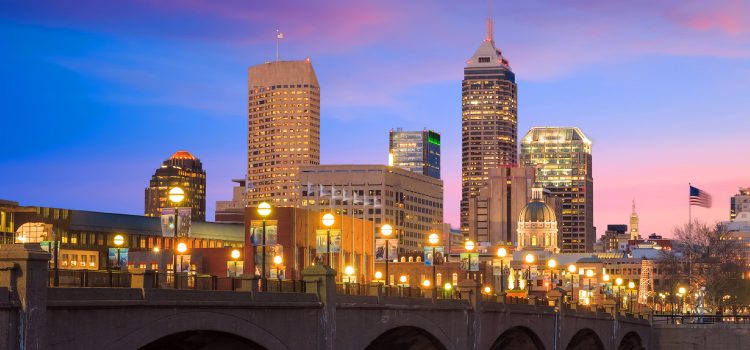
15. Indianapolis, IN
- Median earnings (full-time workers): $42,125
- Median earnings (all workers): $32,122
- Population density (per square mile): 2,389
- Population: 864,131
- Land area (square miles): 361.6
TRENDING
Thinking of investing in a rental property? Be sure to read our guides on how to start investing in real estate and the pros and cons of turnkey properties.
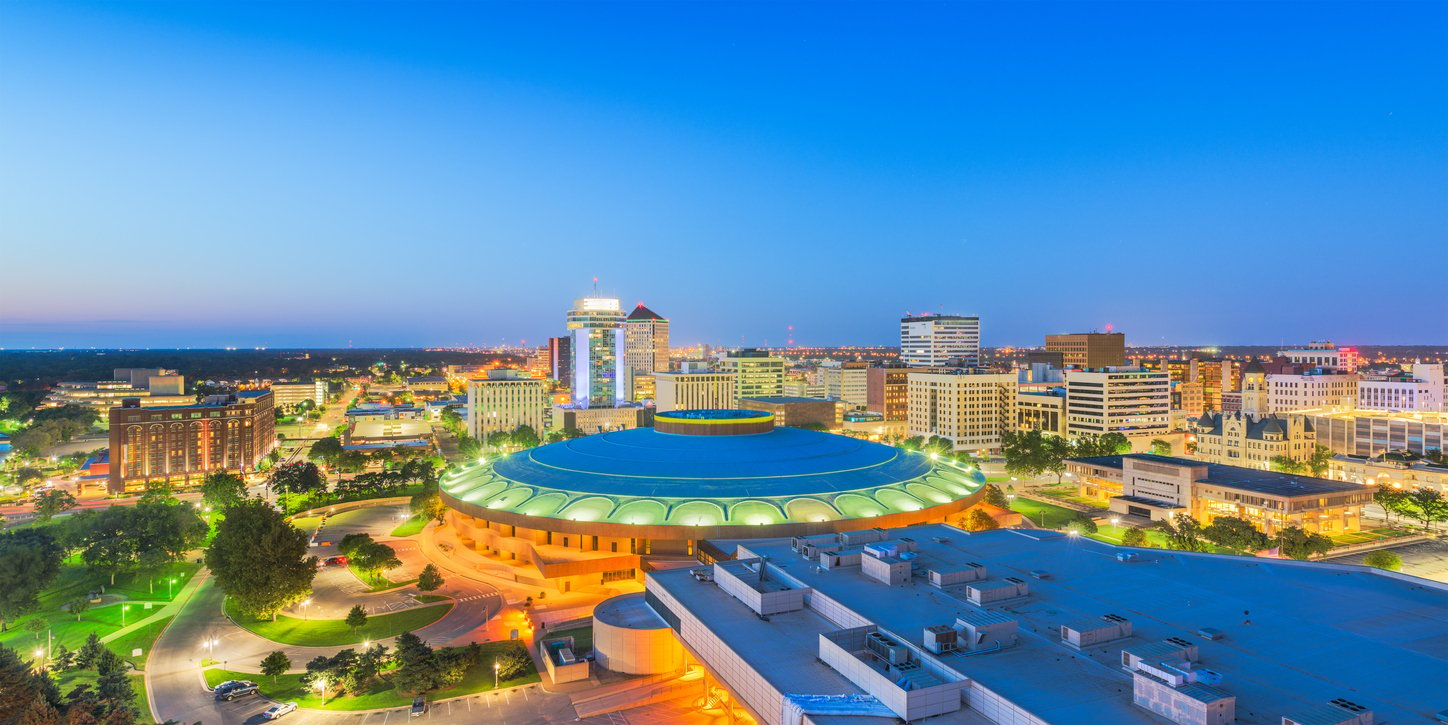
14. Wichita, KS
- Median earnings (full-time workers): $42,137
- Median earnings (all workers): $30,972
- Population density (per square mile): 2,403
- Population: 389,259
- Land area (square miles): 162.0
Photo Credit: Alamy Stock Photo

13. Aurora, CO
- Median earnings (full-time workers): $42,841
- Median earnings (all workers): $33,857
- Population density (per square mile): 2,333
- Population: 373,487
- Land area (square miles): 160.1
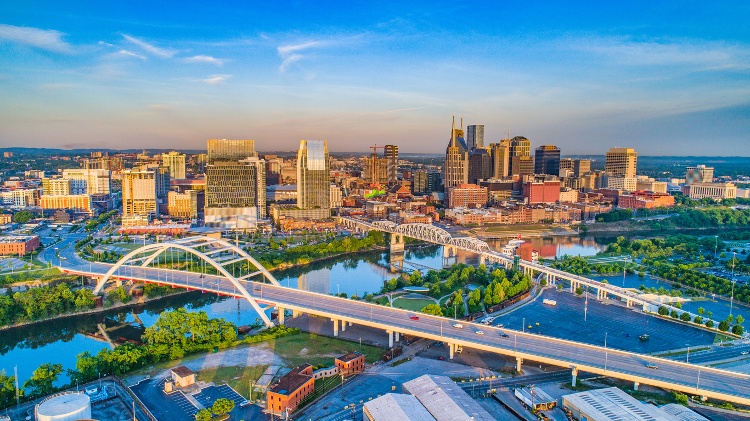
12. Nashville-Davidson, TN
- Median earnings (full-time workers): $43,518
- Median earnings (all workers): $35,237
- Population density (per square mile): 1,399
- Population: 665,498
- Land area (square miles): 475.6
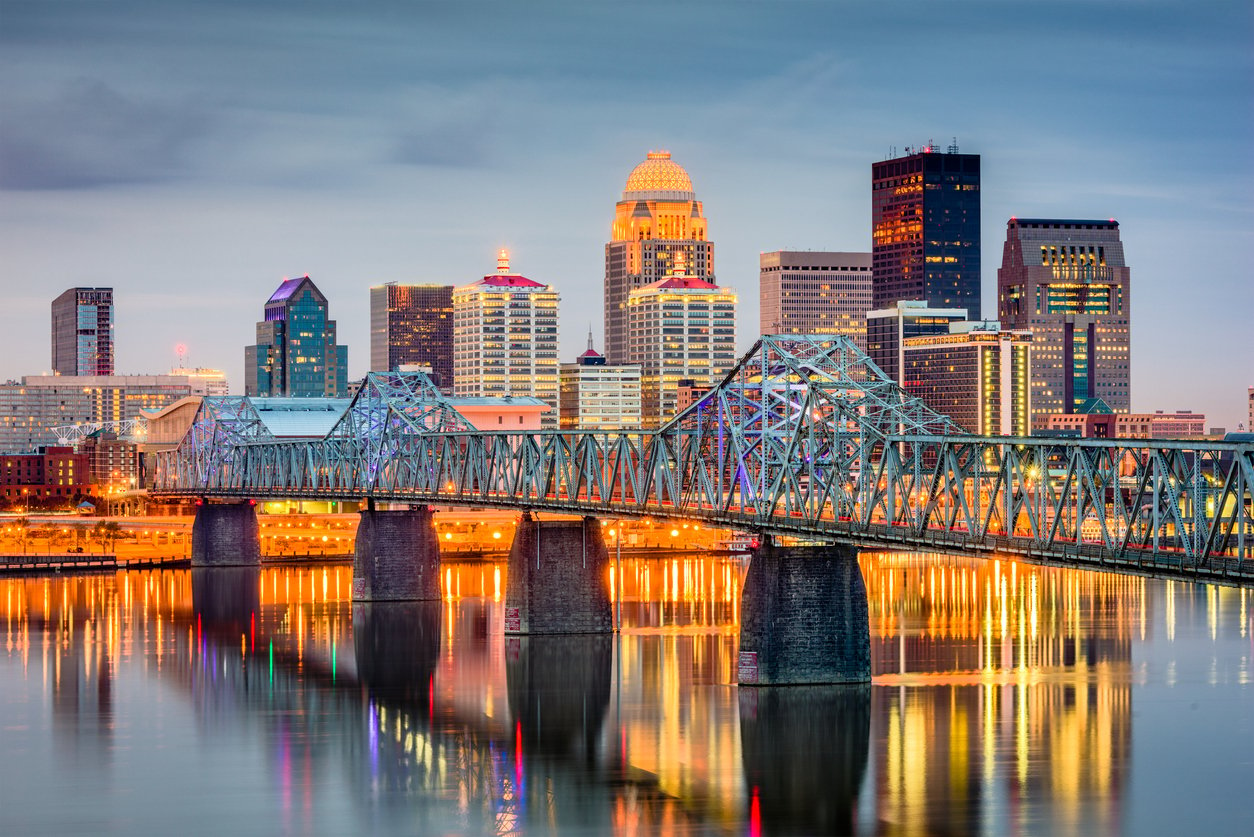
11. Louisville/Jefferson County, KY
- Median earnings (full-time workers): $44,275
- Median earnings (all workers): $31,848
- Population density (per square mile): 1,629
- Population: 620,149
- Land area (square miles): 380.8

10. Fort Worth, TX
- Median earnings (full-time workers): $44,699
- Median earnings (all workers): $32,911
- Population density (per square mile): 2,589
- Population: 898,919
- Land area (square miles): 347.3
Photo Credit: Alamy Stock Photo

9. Bakersfield, CA
- Median earnings (full-time workers): $45,288
- Median earnings (all workers): $31,527
- Population density (per square mile): 2,561
- Population: 383,601
- Land area (square miles): 149.8

8. New Orleans, LA
- Median earnings (full-time workers): $45,448
- Median earnings (all workers): $31,346
- Population density (per square mile): 2,307
- Population: 391,006
- Land area (square miles): 169.5
RELATED
Many low-density cities offer attractive real estate investment opportunities. Before moving forward, learn the ins and outs of buying rental property out of state and selling a rental property with tenants.
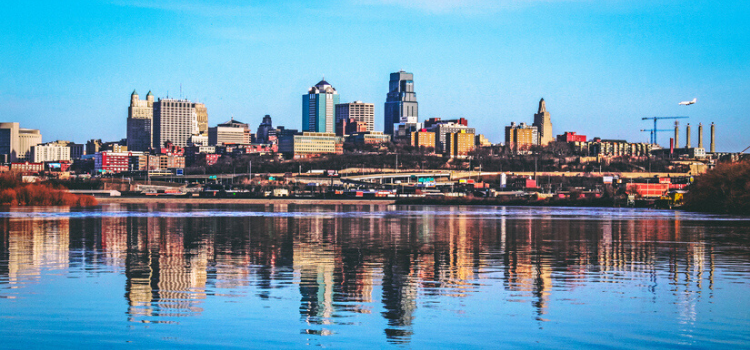
7. Kansas City, MO
- Median earnings (full-time workers): $46,213
- Median earnings (all workers): $36,195
- Population density (per square mile): 1,563
- Population: 491,809
- Land area (square miles): 314.7
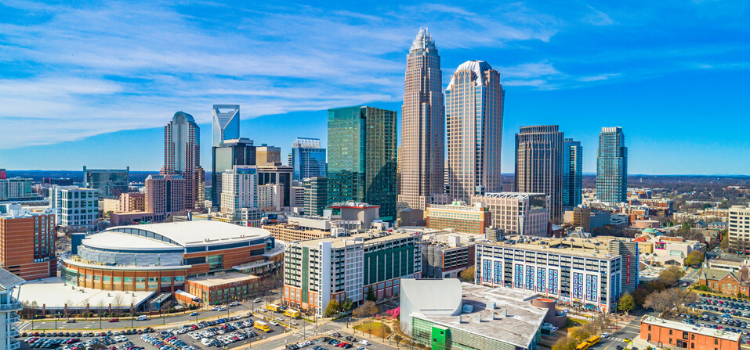
6. Charlotte, NC
- Median earnings (full-time workers): $46,265
- Median earnings (all workers): $36,340
- Population density (per square mile): 2,830
- Population: 872,506
- Land area (square miles): 308.3
Photo Credit: Alamy Stock Photo

5. Omaha, NE
- Median earnings (full-time workers): $46,982
- Median earnings (all workers): $34,045
- Population density (per square mile): 3,308
- Population: 468,267
- Land area (square miles): 141.6
Photo Credit: Alamy Stock Photo

4. Colorado Springs, CO
- Median earnings (full-time workers): $47,499
- Median earnings (all workers): $33,260
- Population density (per square mile): 2,419
- Population: 472,666
- Land area (square miles): 195.4
TRENDING
With record numbers of people moving, owning a rental property could provide you with a consistent source of income. To get started, we’ve created a new guide on how to find cash flow properties.
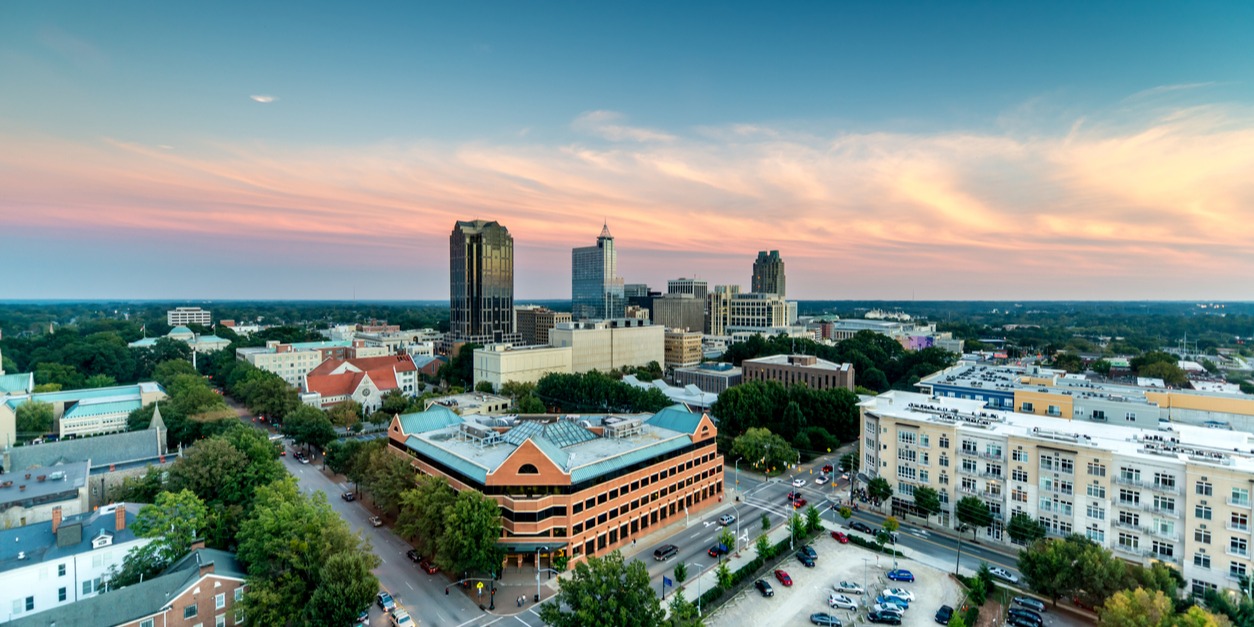
3. Raleigh, NC
- Median earnings (full-time workers): $49,187
- Median earnings (all workers): $38,346
- Population density (per square mile): 3,198
- Population: 470,509
- Land area (square miles): 147.1
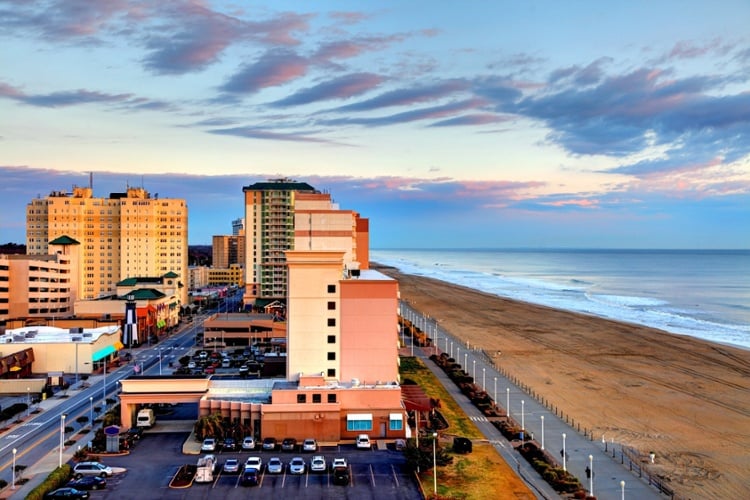
2. Virginia Beach, VA
- Median earnings (full-time workers): $49,913
- Median earnings (all workers): $39,690
- Population density (per square mile): 1,840
- Population: 450,189
- Land area (square miles): 244.7
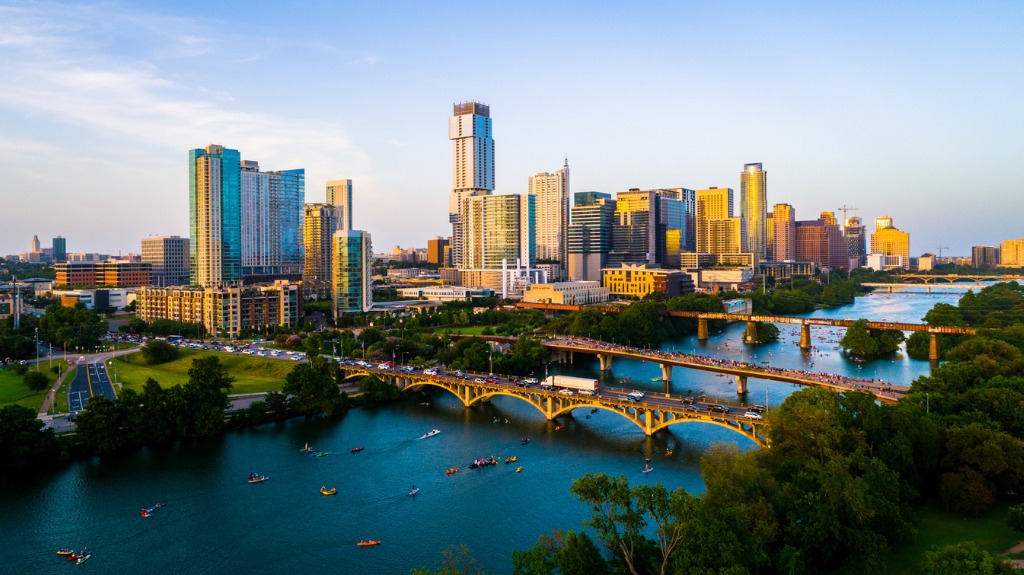
1. Austin, TX
- Median earnings (full-time workers): $54,834
- Median earnings (all workers): $41,653
- Population density (per square mile): 3,014
- Population: 964,243
- Land area (square miles): 319.9
Methodology & full results
Statistics on median earnings and population are from the U.S. Census Bureau 2018 American Community Survey 1-Year Estimates. All median earnings statistics are for workers 16 years and over with earnings. Land areas for each city are from the U.S. Census Bureau’s TIGERweb data.
For the purpose of this analysis, researchers only considered the 324 U.S. cities with at least 100,000 residents. Population densities for each of these 324 cities were calculated by dividing the 2018 population by the total land area in square miles. Cities with population densities that exceeded the median population density of the 324 cities (3,419 people per square mile) were filtered out. Looking only at the remaining 162 cities, the researchers ranked them by their respective median earnings for full-time workers. In the event of a tie, the city with the higher median earnings for all workers was ranked higher. Nationwide, the median annual earnings for full-time workers was $48,328 in 2018 and that for all workers was $35,291.
Interestingly, the reverse urbanization trend showed signs prior to COVID-19. A Brookings Institute analysis of Census Bureau data found that many major cities with more than 1 million residents were experiencing slowing growth rates or population declines over the past four years, while smaller cities and suburbs were more likely to experience higher growth rates.
Furthermore, both the Brookings Institute analysis and Harris Poll noted that younger demographics have been fueling the desire to move away from large cities. According to The Harris Poll's data, 18-to-34-year-olds were the most likely age group to express interest in moving to a less crowded area due to COVID-19. As migration patterns evolve in the wake of the pandemic, population densities across U.S. cities—as well as investment in those cities—could also experience significant changes.