With both real estate and rental prices rising quickly over the last two years, U.S. households that don’t currently own a home are facing a major affordability crunch.
The residential real estate market took off shortly after the COVID-19 pandemic began. Boosted by increased savings, low interest rates, and government stimulus programs and motivated by a desire for more living space, buyers rushed into the market. The increased competition sent home prices to record heights. But now, with interest rates rising in efforts to cool the market and higher prices being a new normal, many would-be buyers have been priced out.
This state of affairs has left more prospective buyers in the rental market, and as a result of increased demand, rents have spiked dramatically over the last year and a half. The early months of the COVID-19 pandemic in 2020 saw rents remain flat while eviction moratoriums and federal rental assistance programs were in place. But with those programs expired and heightened competition for rentals, rents have taken off: in 2021, the median rent rose by 17.6%, and median rent is up by another 6.7% already in 2022.
For homeowners and landlords whose costs are locked in, the current market has been a boon. Homeowners have gained an estimated $6 trillion in equity during the pandemic. Landlords—especially larger corporate owners—are benefiting from greater profit margins as they raise rents to account for market conditions.
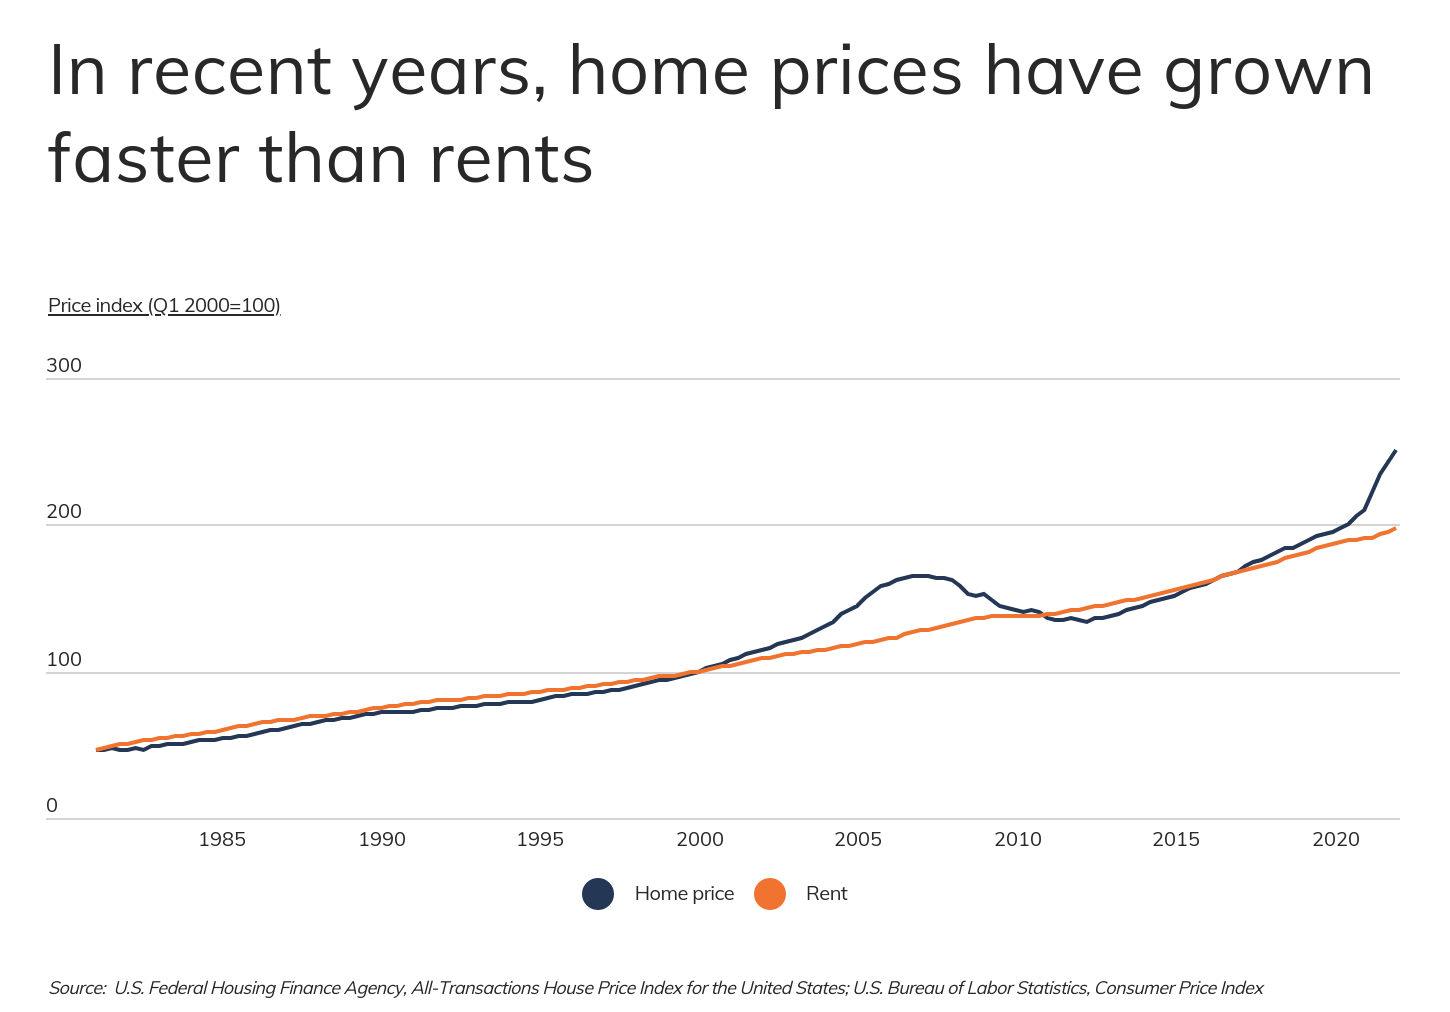
But non-homeowners face difficult choices in a market like this one—and based on recent trends, the squeeze for renters could continue. The rate of increase in home prices exceeded the rate of growth for rents even before the pandemic took hold, but recent conditions have widened the gap. This poses a dilemma for renters: try to stretch their budgets to purchase homes that have grown more expensive, or live with rising rents and risk home values climbing further out of reach.
A location’s rent-to-price ratio is one metric that potential buyers can use to assess whether it makes more sense to continue renting or try to purchase a home in their area. In markets where the ratio of rents to the cost of homeownership are higher, purchasing a home makes more sense. In locations with lower rent-to-price ratios, where costs of homeownership exceed rents, real estate may be overvalued.
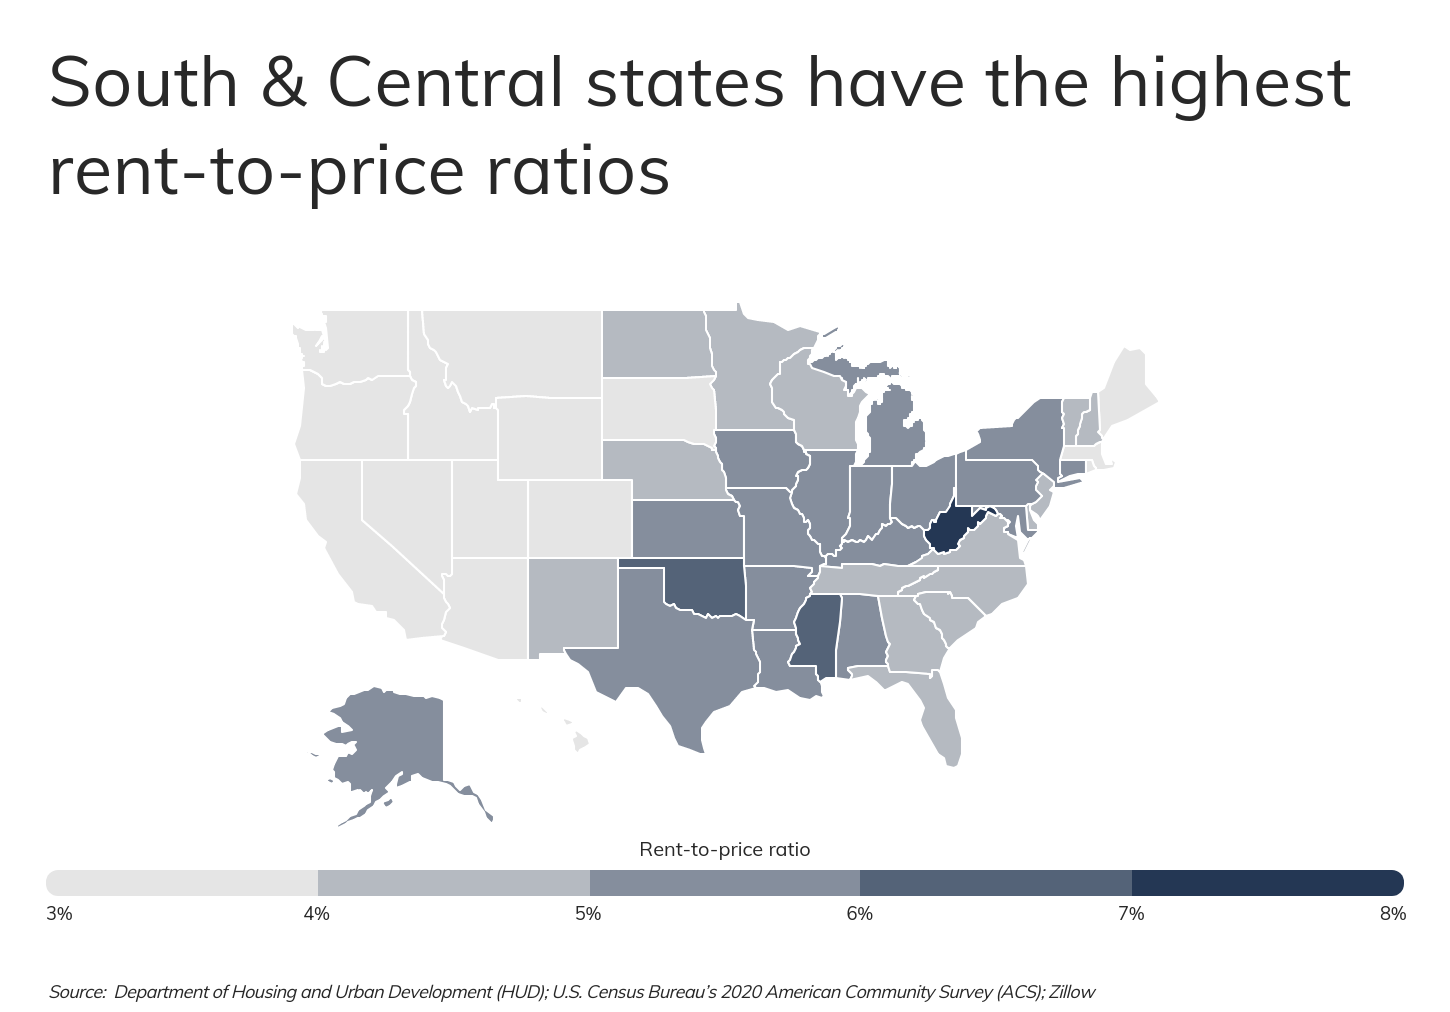
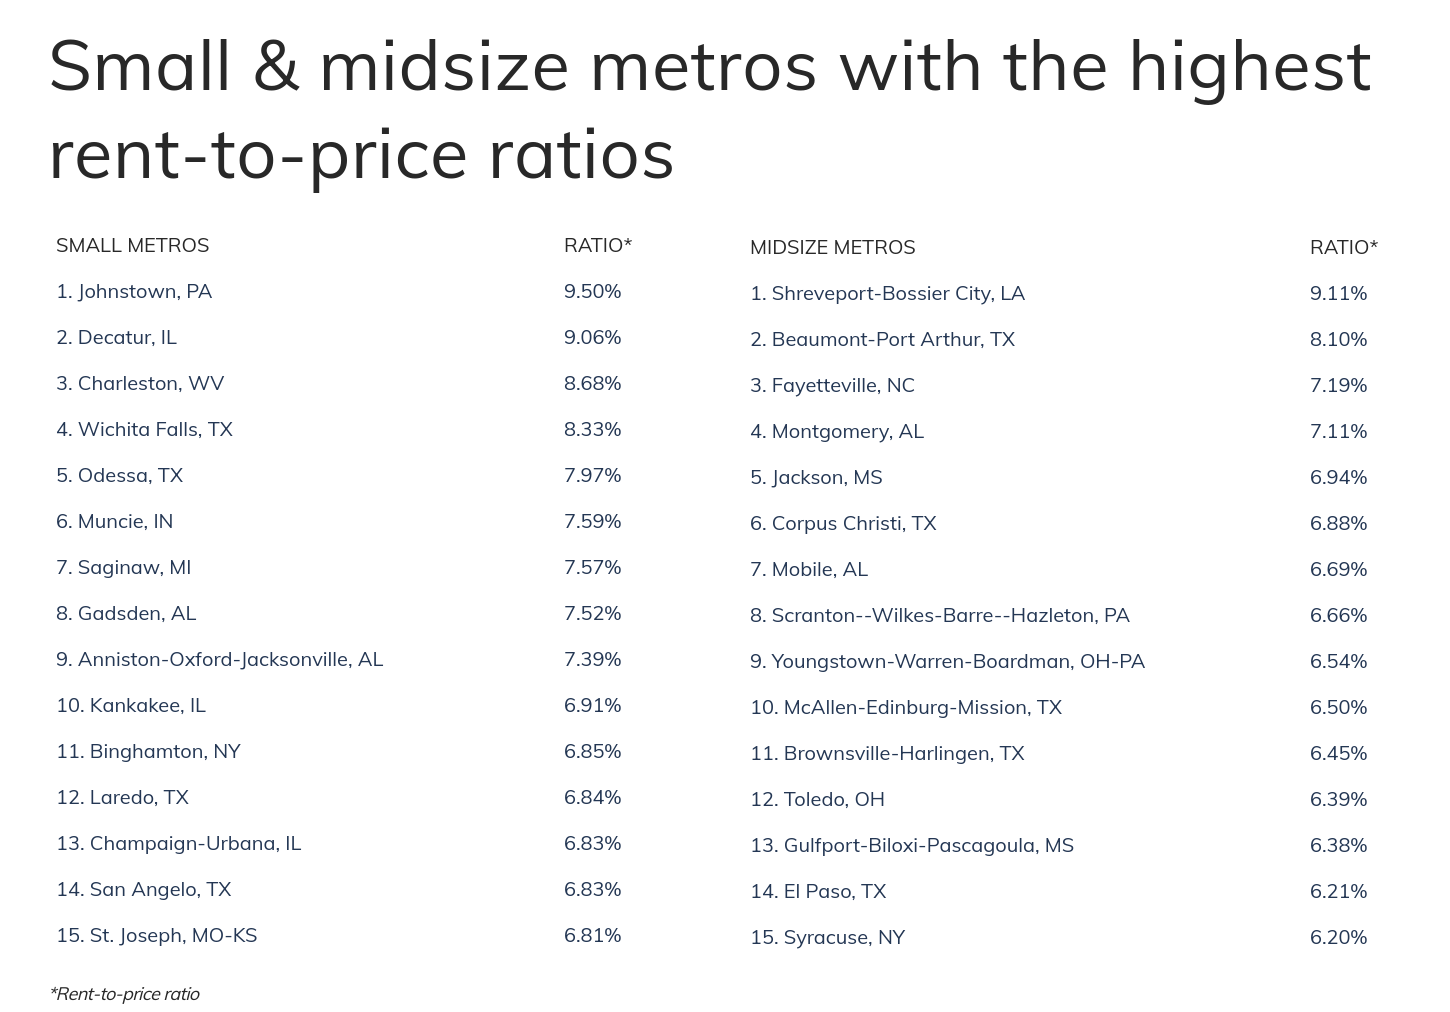
Most U.S. locations with the highest rent-to-price ratios are found in the South and Midwest. At the state level, some of the most affordable places in the U.S. to buy a home, like West Virginia and Mississippi, lead the country in rent-to-price ratio. In contrast, states in the Mountain West where real estate values have increased rapidly in recent years, like Montana, Utah, and Idaho, have lower ratios. At the local level, cities in the Rust Belt and other areas where housing is available and inexpensive tend to have higher rent-to-price ratios that point toward purchasing a home.
RELATED
Learn about turnkey properties, calculating property cash flow, and more with Roofstock’s detailed real estate guides.
To find the locations with the highest rent-to-price ratios, Roofstock crunched numbers from the Department of Housing and Urban Development (HUD), Zillow, and the Census Bureau. The rent-to-price ratio was calculated as the ratio of annualized median rent from HUD to Zillow’s current Home Value Index. For additional context, the monthly mortgage payment for a median-price home was calculated assuming a 30-year fixed mortgage, 20% down payment, and a 5.22% interest rate.
Here are the U.S. metropolitan areas with the highest rent-to-price ratios.
Large metros with the highest rent-to-price ratios

15. Hartford-West Hartford-East Hartford, CT
- Rent-to-price ratio: 5.04%
- Median rent approximation: $1,361
- Median home price: $323,880
- Monthly mortgage payment for a median-price home: $1,426

14. St. Louis, MO-IL
- Rent-to-price ratio: 5.08%
- Median rent approximation: $1,035
- Median home price: $244,294
- Monthly mortgage payment for a median-price home: $1,076
13. Buffalo-Cheektowaga-Niagara Falls, NY
- Rent-to-price ratio: 5.14%
- Median rent approximation: $1,069
- Median home price: $249,405
- Monthly mortgage payment for a median-price home: $1,098
TRENDING
Curious whether you can sell your rental property with your tenant in place? Read our guide on selling a rental property with tenants and know your options.

12. Louisville/Jefferson County, KY-IN
- Rent-to-price ratio: 5.31%
- Median rent approximation: $1,069
- Median home price: $241,642
- Monthly mortgage payment for a median-price home: $1,064
11. Virginia Beach-Norfolk-Newport News, VA-NC
- Rent-to-price ratio: 5.31%
- Median rent approximation: $1,454
- Median home price: $328,320
- Monthly mortgage payment for a median-price home: $1,446

10. Cleveland-Elyria, OH
- Rent-to-price ratio: 5.35%
- Median rent approximation: $982
- Median home price: $220,420
- Monthly mortgage payment for a median-price home: $970

9. New Orleans-Metairie, LA
- Rent-to-price ratio: 5.35%
- Median rent approximation: $1,209
- Median home price: $271,110
- Monthly mortgage payment for a median-price home: $1,194

8. Birmingham-Hoover, AL
- Rent-to-price ratio: 5.37%
- Median rent approximation: $1,100
- Median home price: $245,833
- Monthly mortgage payment for a median-price home: $1,082

7. Houston-The Woodlands-Sugar Land, TX
- Rent-to-price ratio: 5.41%
- Median rent approximation: $1,410
- Median home price: $312,533
- Monthly mortgage payment for a median-price home: $1,376

6. Chicago-Naperville-Elgin, IL-IN-WI
- Rent-to-price ratio: 5.53%
- Median rent approximation: $1,447
- Median home price: $313,828
- Monthly mortgage payment for a median-price home: $1,382

5. Memphis, TN-MS-AR
- Rent-to-price ratio: 5.55%
- Median rent approximation: $1,077
- Median home price: $233,002
- Monthly mortgage payment for a median-price home: $1,026

4. Oklahoma City, OK
- Rent-to-price ratio: 5.80%
- Median rent approximation: $1,056
- Median home price: $218,494
- Monthly mortgage payment for a median-price home: $962

3. Detroit-Warren-Dearborn, MI
- Rent-to-price ratio: 5.89%
- Median rent approximation: $1,192
- Median home price: $243,049
- Monthly mortgage payment for a median-price home: $1,070

2. Rochester, NY
- Rent-to-price ratio: 5.96%
- Median rent approximation: $1,085
- Median home price: $218,475
- Monthly mortgage payment for a median-price home: $962
RELATED
Many cities with high rent-to-price ratios offer attractive real estate investment opportunities. Learn everything you need to know about how to start investing in real estate.

1. Pittsburgh, PA
- Rent-to-price ratio: 6.02%
- Median rent approximation: $1,063
- Median home price: $211,871
- Monthly mortgage payment for a median-price home: $933
Methodology & detailed findings
To find the metros with the highest rent to home price ratios, Roofstock crunched numbers from the Department of Housing and Urban Development’s 50th Percentile Rent Estimates, the U.S. Census Bureau’s 2020 American Community Survey (ACS), and Zillow’s Zillow Home Value Index. The rent-to-price ratio was calculated as the ratio of annualized median rent to Zillow’s Home Value Index. Median rent was calculated as the weighted average of rent for a studio, 1-bedroom, 2-bedroom, 3-bedroom, and 4-bedroom apartment. The number of renter households by bedroom from the ACS were used as weights. Median home price comes from Zillow’s most recent home value index.
The monthly mortgage payment for a median-price home assumed a 30-year fixed mortgage, 20% down payment, and a 5.22% interest rate. Additionally, metros were grouped into the following cohorts based on population size:
- Small metros: 100,000–349,999
- Midsize metros: 350,000–999,999
- Large metros: 1,000,000 or more