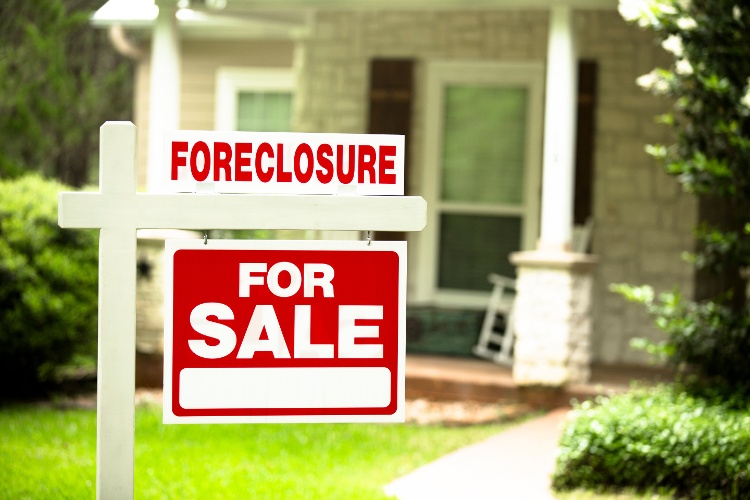
When the COVID-19 pandemic reached the U.S. early in 2020, the public health crisis was accompanied by an economic disaster as well. As businesses scaled back their operations or closed permanently in response to stay-at-home orders and decreased consumer demand, millions of people lost hours or had their jobs eliminated altogether, putting their personal finances in danger. For many of these hard-hit individuals, one of the biggest worries was housing, with renters fearing evictions if they could not afford rent and homeowners concerned about falling behind on mortgage payments.
The government ultimately stepped in with robust stimulus measures to stabilize the economy and keep people from losing their homes. Notably, the CARES Act passed by Congress in March 2020 created eviction and foreclosure moratoriums and provided an option for homeowners with federally backed mortgages to request COVID hardship forbearance. The forbearance option allowed homeowners to pause or reduce loan payments for a temporary period—in some cases, up to 18 months. Both the moratorium and the forbearance options have been extended through June 2021 to provide more support to borrowers. And while the CARES Act only covered federally backed mortgages, many private lenders followed suit and voluntarily offered their own relief.
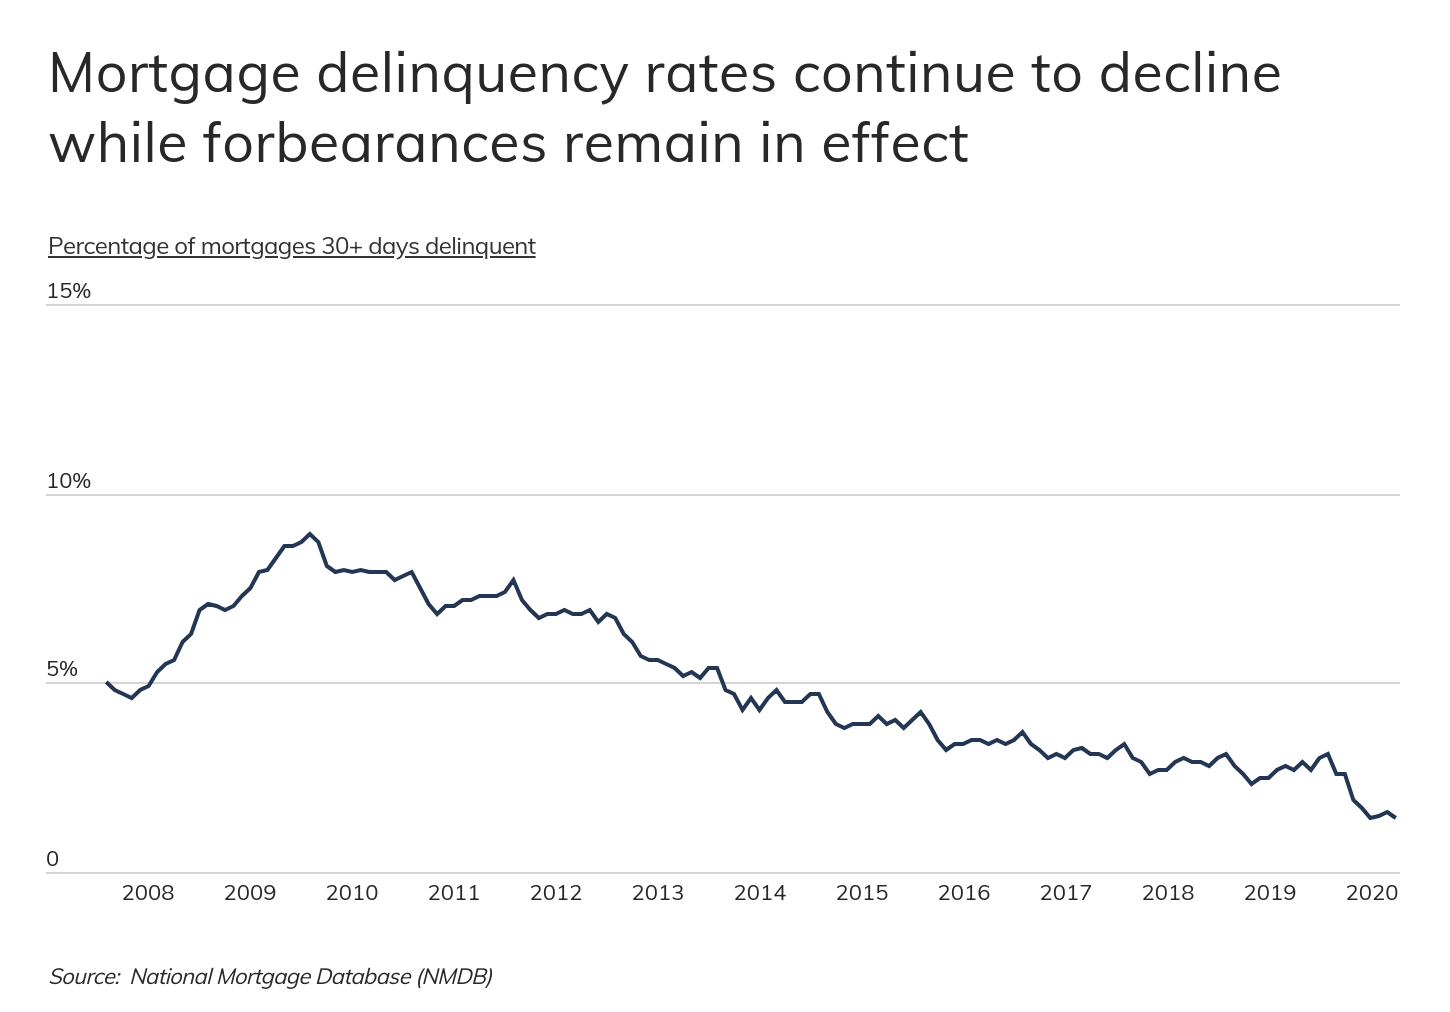
Forbearance and other government supports like stimulus checks and expanded unemployment benefits have so far kept homeowners from falling into delinquency on their mortgage payments. During the last recession, the collapse of the housing bubble and subprime mortgage crisis led to a spike in mortgage delinquency rates in the first few years of the downturn, followed by a gradual improvement over the last decade. But in 2020, mortgage delinquency rates actually took a noticeable turn downward in the months after the pandemic struck and the passage of the CARES Act. From January to June 2020, the percentage of mortgages that were 30+ days delinquent each month dropped by more than half, from 3.1% to 1.4%. Put another way, mortgage delinquency rates declined at the same time that job loss and economic uncertainty were at their highest.
This has been important during the pandemic because under more normal conditions, an area’s economic characteristics are a strong indicator of how likely it is that a homeowner in that area will fall behind on their mortgage payments. In particular, there is a noticeable negative correlation between mortgage delinquency rates and median household income, meaning that as income rises, delinquency rates decline. The correlation between poverty rates and mortgage delinquency is positive, meaning that they move upward together. The same point is true by either metric: if members of a household have more economic resources, it is less likely that they will fall behind on their home loan payments.
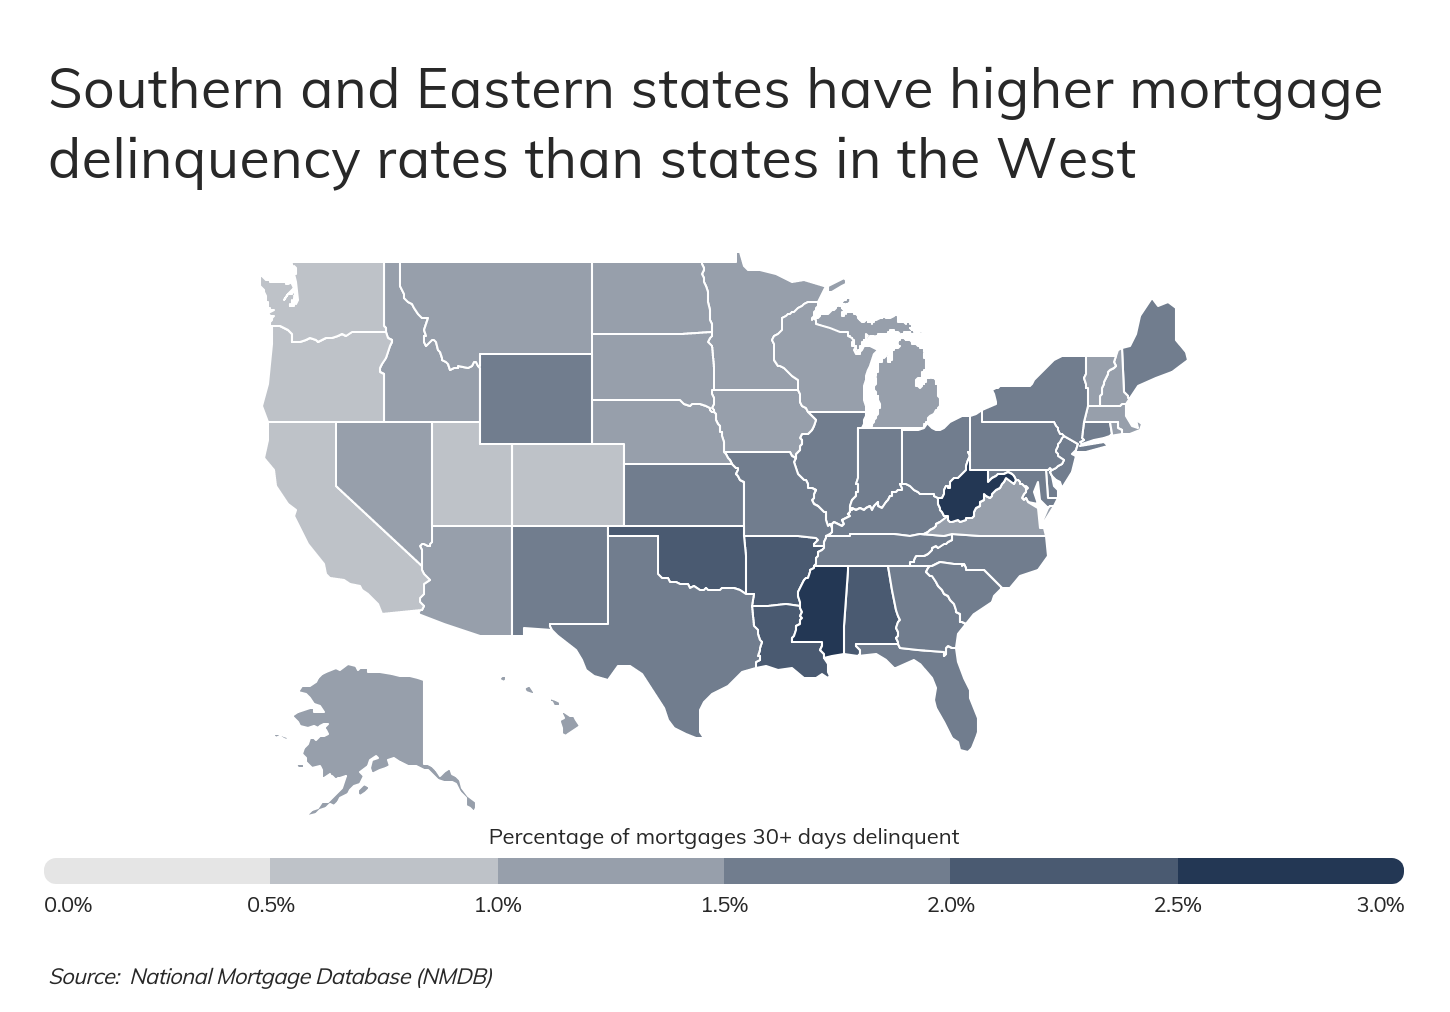
For that reason, many of the nation’s most economically distressed regions show higher rates of mortgage delinquency. Low-income, high-poverty states like Mississippi, West Virginia, and Louisiana lead the nation in mortgage delinquency, while more economically prosperous West Coast states Washington, Oregon, and California have the lowest rates. Interestingly, one factor that does not appear to increase the chances of mortgage delinquency is higher home value. Homes are least expensive in West Virginia and Mississippi among states, while typical housing prices in the West are significantly higher than in the rest of the country. This fact helps reinforce the impacts of income and poverty on mortgage delinquency: even when loan amounts are much larger, having more resources available means that well-off households are better able to keep up with their payments.

RELATED
Cash flow property is rental real estate that generates greater cash returns than comparable property. Learn more about cash flow properties and how to start investing in real estate with Roofstock.
The same patterns hold at the metro level. Many economically distressed cities in the South and the Rust Belt region top the list of cities with the highest rates of mortgage delinquency, attributable to their lower household incomes and higher poverty rates.
To identify these locations, our researchers used data from the National Mortgage Database (NMDB) to analyze delinquency rates. The researchers also gathered data on home values in each metro from Zillow, along with data on household income and poverty from the U.S. Census Bureau.
Here are the U.S. metros with the highest rates of mortgage delinquency.

Large metros with the highest rates of mortgage delinquency

15. Louisville-Jefferson County, KY-IN
- Percentage of mortgages 30+ days delinquent: 1.5%
- Percentage of mortgages 90+ days delinquent: 0.6%
- Percentage of mortgages 30-89 days delinquent: 0.9%
- Median home value: $200,197
- Median household income: $61,172
- Poverty rate: 11.9%
DID YOU KNOW?
Read our comprehensive guide on how and when you should consider selling a rental property with tenants.

14. New Orleans-Metairie, LA
- Percentage of mortgages 30+ days delinquent: 1.6%
- Percentage of mortgages 90+ days delinquent: 0.6%
- Percentage of mortgages 30-89 days delinquent: 1.0%
- Median home value: $226,517
- Median household income: $55,710
- Poverty rate: 16.4%

13. Virginia Beach-Norfolk-Newport News, VA-NC
- Percentage of mortgages 30+ days delinquent: 1.6%
- Percentage of mortgages 90+ days delinquent: 0.6%
- Percentage of mortgages 30-89 days delinquent: 1.0%
- Median home value: $267,161
- Median household income: $69,329
- Poverty rate: 10.6%

12. Cleveland-Elyria, OH
- Percentage of mortgages 30+ days delinquent: 1.6%
- Percentage of mortgages 90+ days delinquent: 0.7%
- Percentage of mortgages 30-89 days delinquent: 0.9%
- Median home value: $177,598
- Median household income: $57,228
- Poverty rate: 13.5%

11. Baltimore-Columbia-Towson, MD
- Percentage of mortgages 30+ days delinquent: 1.6%
- Percentage of mortgages 90+ days delinquent: 0.7%
- Percentage of mortgages 30-89 days delinquent: 0.9%
- Median home value: $323,406
- Median household income: $83,160
- Poverty rate: 9.4%

10. New York-Newark-Jersey City, NY-NJ-PA
- Percentage of mortgages 30+ days delinquent: 1.6%
- Percentage of mortgages 90+ days delinquent: 0.9%
- Percentage of mortgages 30-89 days delinquent: 0.7%
- Median home value: $520,587
- Median household income: $83,160
- Poverty rate: 11.6%

9. Hartford-East Hartford-Middletown, CT
- Percentage of mortgages 30+ days delinquent: 1.7%
- Percentage of mortgages 90+ days delinquent: 0.9%
- Percentage of mortgages 30-89 days delinquent: 0.8%
- Median home value: $263,441
- Median household income: $77,005
- Poverty rate: 10.1%

8. Indianapolis-Carmel-Anderson, IN
- Percentage of mortgages 30+ days delinquent: 1.7%
- Percentage of mortgages 90+ days delinquent: 0.6%
- Percentage of mortgages 30-89 days delinquent: 1.1%
- Median home value: $205,859
- Median household income: $62,502
- Poverty rate: 10.5%

7. San Antonio-New Braunfels, TX
- Percentage of mortgages 30+ days delinquent: 1.7%
- Percentage of mortgages 90+ days delinquent: 0.6%
- Percentage of mortgages 30-89 days delinquent: 1.1%
- Median home value: $225,999
- Median household income: $62,355
- Poverty rate: 13.5%

6. Oklahoma City, OK
- Percentage of mortgages 30+ days delinquent: 1.8%
- Percentage of mortgages 90+ days delinquent: 0.7%
- Percentage of mortgages 30-89 days delinquent: 1.1%
- Median home value: $171,597
- Median household income: $60,605
- Poverty rate: 13.1%
.jpg?width=1024&name=houston-texas-usa-skyline-picture-id1004243142%20(2).jpg)
5. Houston-The Woodlands-Sugar Land, TX
- Percentage of mortgages 30+ days delinquent: 1.8%
- Percentage of mortgages 90+ days delinquent: 0.7%
- Percentage of mortgages 30-89 days delinquent: 1.1%
- Median home value: $235,792
- Median household income: $69,193
- Poverty rate: 12.9%

4. Birmingham-Hoover, AL
- Percentage of mortgages 30+ days delinquent: 1.9%
- Percentage of mortgages 90+ days delinquent: 0.7%
- Percentage of mortgages 30-89 days delinquent: 1.2%
- Median home value: $192,094
- Median household income: $58,366
- Poverty rate: 14.0%

3. Memphis, TN-MS-AR
- Percentage of mortgages 30+ days delinquent: 1.9%
- Percentage of mortgages 90+ days delinquent: 0.8%
- Percentage of mortgages 30-89 days delinquent: 1.1%
- Median home value: $175,627
- Median household income: $54,859
- Poverty rate: 15.4%
TRENDING
Are you considering entering a rental real estate market you don’t live in? A turnkey property can make it easy to invest in real estate from long-distance.

2. Pittsburgh, PA
- Percentage of mortgages 30+ days delinquent: 2.0%
- Percentage of mortgages 90+ days delinquent: 0.8%
- Percentage of mortgages 30-89 days delinquent: 1.2%
- Median home value: $179,774
- Median household income: $62,638
- Poverty rate: 10.9%

1. Philadelphia-Camden-Wilmington, PA-NJ-DE-MD
- Percentage of mortgages 30+ days delinquent: 2.0%
- Percentage of mortgages 90+ days delinquent: 0.9%
- Percentage of mortgages 30-89 days delinquent: 1.1%
- Median home value: $280,522
- Median household income: $74,533
- Poverty rate: 11.8%
Methodology & detailed findings
To find the locations with the highest rates of mortgage delinquency, researchers analyzed the latest data from the National Mortgage Database (NMDB). Home value data came from the Zillow Home Value Index, and household income and poverty rates were sourced from the U.S. Census Bureau’s 2019 American Community Survey. To improve relevance, only metropolitan areas with at least 100,000 residents were included in the analysis. Metros were also grouped into cohorts based on population: small (100,000–349,999), midsize (350,000–999,999), and large (1,000,000 or more).