Since the last recession, one of the key drivers of growth in new residential construction has been high-density housing. After the housing bubble burst in the mid-2000s, new construction began to rebound around 2009, and in the ensuing decade, annual construction of structures with 5 or more units increased by nearly 300 percent.
This pattern has paralleled a trend toward higher-density living in urban centers. In recent years, many cities have grown, with new residents gravitating toward the lifestyle, amenities, and economic opportunities available in the heart of urban areas. Affordable, single-family housing can be hard to come by in such areas, so higher-density rental units are often best able to accommodate new and existing residents’ housing needs. This means that far fewer renters (32.9 percent) live in single-family residences than homeowners do (88.4 percent).
Today, however, the COVID-19 pandemic has disrupted this status quo, and 2020 saw a surging demand for single-family rentals. Densely populated structures are less conducive to the social distancing measures necessary during the pandemic, and small apartments hold less appeal when the whole household is working and schooling from home.

As a result, multi-family rental units of all sizes have had vacancy rates move upward this year. Vacancy rates for structures of 2 or more units increased from 6.5 percent to 7.7 percent between the second and third quarters of 2020, while rates in structures of 5 or more units rose from 7.2 percent to 8.7 percent over the same period. In contrast, vacancy rates for single-family dipped below 5 percent in the second quarter of 2020 and have held steady at 4.7 percent since.
RELATED
Are you looking for a good investment opportunity? Learning how to start investing in real estate and how to find cash flow properties is a good place to start.

This emerging preference for single-family rental units will strain some states’ rental markets more than others. Northeastern states like New York (11.5 percent) and Massachusetts (14.6 percent) have the lowest percentages of renters living in single-family units, a product of older, established urban centers like New York City and Boston that accommodate their high populations with dense housing. In contrast, many of the states with the highest share of single-family rentals are more rural states in the Great Plains, Mountain West, and South.
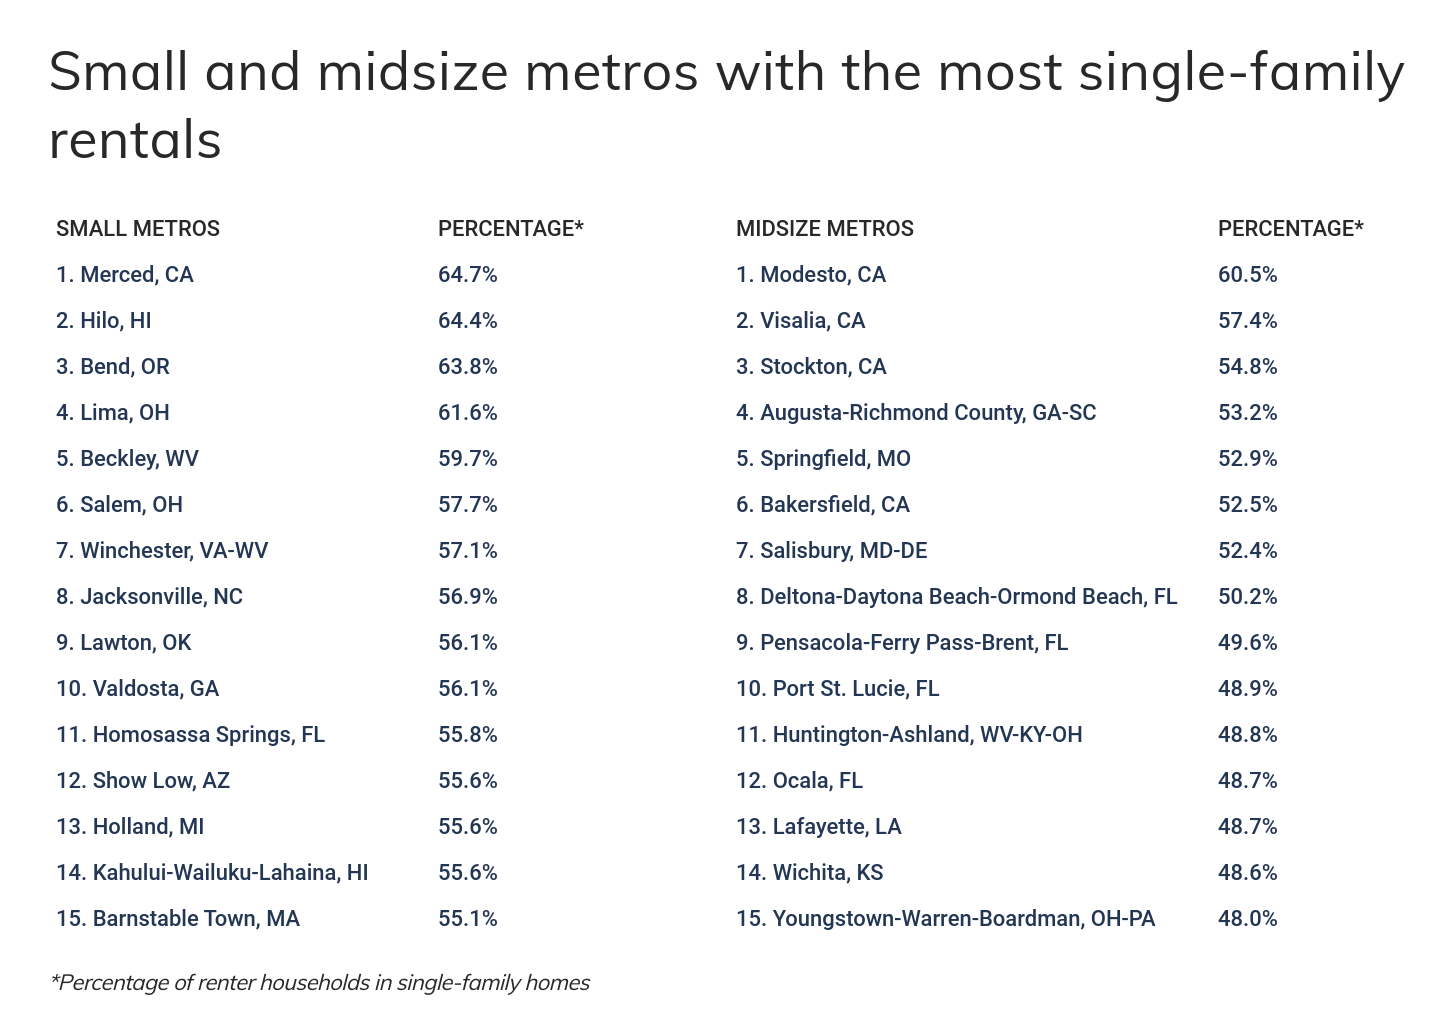
Compared to states, the availability of single-family rentals at the metro level is more variable across the country. Some cities—like the aforementioned New York City and Boston—are constrained in their ability to add low-density homes due to their geographic features or historical development patterns. For newer cities with enough space to grow outward, however, the only limits on the stock of single-family units may be consumers’ demand and the city’s planning and zoning regulations. To find which metropolitan areas have the most single-family rentals, our researchers analyzed U.S. Census data on rentals and housing. For each metro, researchers calculated the proportion of renter households in structures with one unit.
Here are the metros with the most single-family rentals.
Large metros with the most single-family rentals
Photo Credit: Alamy Stock Photo

15. Phoenix-Mesa-Chandler, AZ
- Percentage of renter households in single-family homes: 36.9%
- Percentage of renter households in structures with 2 units: 2.9%
- Percentage of renter households in structures with 3–4 units: 8.8%
- Percentage of renter households in structures with 5+ units: 47.3%
- Percentage of households that rent: 35.4%
DID YOU KNOW?
A turnkey property is an investment property that’s rent-ready when you buy it. Be sure to read all about turnkey real estate before your next real estate venture.

14. Las Vegas-Henderson-Paradise, NV
- Percentage of renter households in single-family homes: 37.0%
- Percentage of renter households in structures with 2 units: 2.6%
- Percentage of renter households in structures with 3–4 units: 14.2%
- Percentage of renter households in structures with 5+ units: 44.1%
- Percentage of households that rent: 45.7%

13. Jacksonville, FL
- Percentage of renter households in single-family homes: 38.0%
- Percentage of renter households in structures with 2 units: 2.6%
- Percentage of renter households in structures with 3–4 units: 9.0%
- Percentage of renter households in structures with 5+ units: 43.1%
- Percentage of households that rent: 34.0%
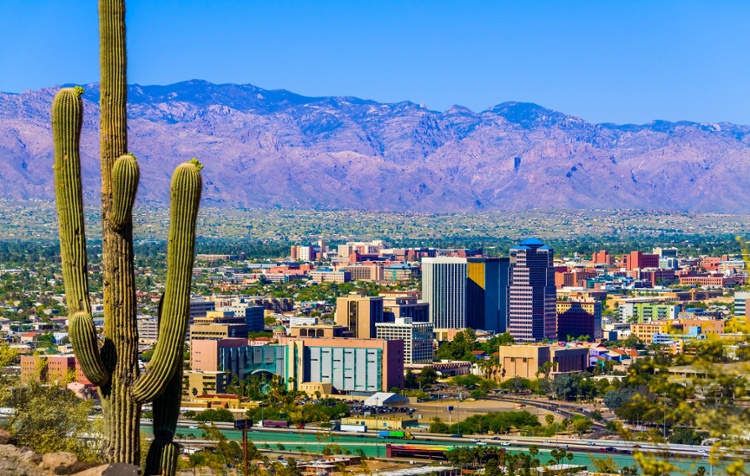
12. Tucson, AZ
- Percentage of renter households in single-family homes: 38.0%
- Percentage of renter households in structures with 2 units: 5.3%
- Percentage of renter households in structures with 3–4 units: 6.8%
- Percentage of renter households in structures with 5+ units: 44.7%
- Percentage of households that rent: 37.0%

11. Birmingham-Hoover, AL
- Percentage of renter households in single-family homes: 38.2%
- Percentage of renter households in structures with 2 units: 3.4%
- Percentage of renter households in structures with 3–4 units: 8.7%
- Percentage of renter households in structures with 5+ units: 42.9%
- Percentage of households that rent: 32.3%
10. Virginia Beach-Norfolk-Newport News, VA-NC
- Percentage of renter households in single-family homes: 38.2%
- Percentage of renter households in structures with 2 units: 4.0%
- Percentage of renter households in structures with 3–4 units: 9.8%
- Percentage of renter households in structures with 5+ units: 45.5%
- Percentage of households that rent: 38.9%

9. Richmond, VA
- Percentage of renter households in single-family homes: 39.8%
- Percentage of renter households in structures with 2 units: 4.0%
- Percentage of renter households in structures with 3–4 units: 7.0%
- Percentage of renter households in structures with 5+ units: 46.6%
- Percentage of households that rent: 33.7%

8. Indianapolis-Carmel-Anderson, IN
- Percentage of renter households in single-family homes: 39.9%
- Percentage of renter households in structures with 2 units: 4.5%
- Percentage of renter households in structures with 3–4 units: 9.1%
- Percentage of renter households in structures with 5+ units: 44.2%
- Percentage of households that rent: 34.8%

7. Charlotte-Concord-Gastonia, NC-SC
- Percentage of renter households in single-family homes: 40.1%
- Percentage of renter households in structures with 2 units: 3.1%
- Percentage of renter households in structures with 3–4 units: 5.3%
- Percentage of renter households in structures with 5+ units: 44.7%
- Percentage of households that rent: 34.6%

6. Detroit-Warren-Dearborn, MI
- Percentage of renter households in single-family homes: 41.1%
- Percentage of renter households in structures with 2 units: 4.6%
- Percentage of renter households in structures with 3–4 units: 7.5%
- Percentage of renter households in structures with 5+ units: 44.4%
- Percentage of households that rent: 30.4%

5. Kansas City, MO-KS
- Percentage of renter households in single-family homes: 41.2%
- Percentage of renter households in structures with 2 units: 4.3%
- Percentage of renter households in structures with 3–4 units: 9.7%
- Percentage of renter households in structures with 5+ units: 43.8%
- Percentage of households that rent: 34.9%
Photo Credit: Alamy Stock Photo

4. Sacramento-Roseville-Folsom, CA
- Percentage of renter households in single-family homes: 42.4%
- Percentage of renter households in structures with 2 units: 3.4%
- Percentage of renter households in structures with 3–4 units: 10.4%
- Percentage of renter households in structures with 5+ units: 42.0%
- Percentage of households that rent: 39.6%
Photo Credit: Alamy Stock Photo

3. Riverside-San Bernardino-Ontario, CA
- Percentage of renter households in single-family homes: 47.0%
- Percentage of renter households in structures with 2 units: 3.2%
- Percentage of renter households in structures with 3–4 units: 9.8%
- Percentage of renter households in structures with 5+ units: 35.4%
- Percentage of households that rent: 36.1%

2. Oklahoma City, OK
- Percentage of renter households in single-family homes: 47.6%
- Percentage of renter households in structures with 2 units: 4.1%
- Percentage of renter households in structures with 3–4 units: 7.0%
- Percentage of renter households in structures with 5+ units: 36.6%
- Percentage of households that rent: 36.7%
RELATED
We’ve identified six factors that property owners might run into when selling a rental property with tenants still in the unit.

1. Memphis, TN-MS-AR
- Percentage of renter households in single-family homes: 48.0%
- Percentage of renter households in structures with 2 units: 2.9%
- Percentage of renter households in structures with 3–4 units: 9.0%
- Percentage of renter households in structures with 5+ units: 36.6%
- Percentage of households that rent: 41.2%
Detailed Findings & Methodology
When considering the relationship between the percentage of single-family home renters and median monthly rent, there is no pronounced correlation. This suggests that other, more significant variables are likely influencing the availability of single-family rentals, such as population density, building codes, and zoning regulations, among other factors.
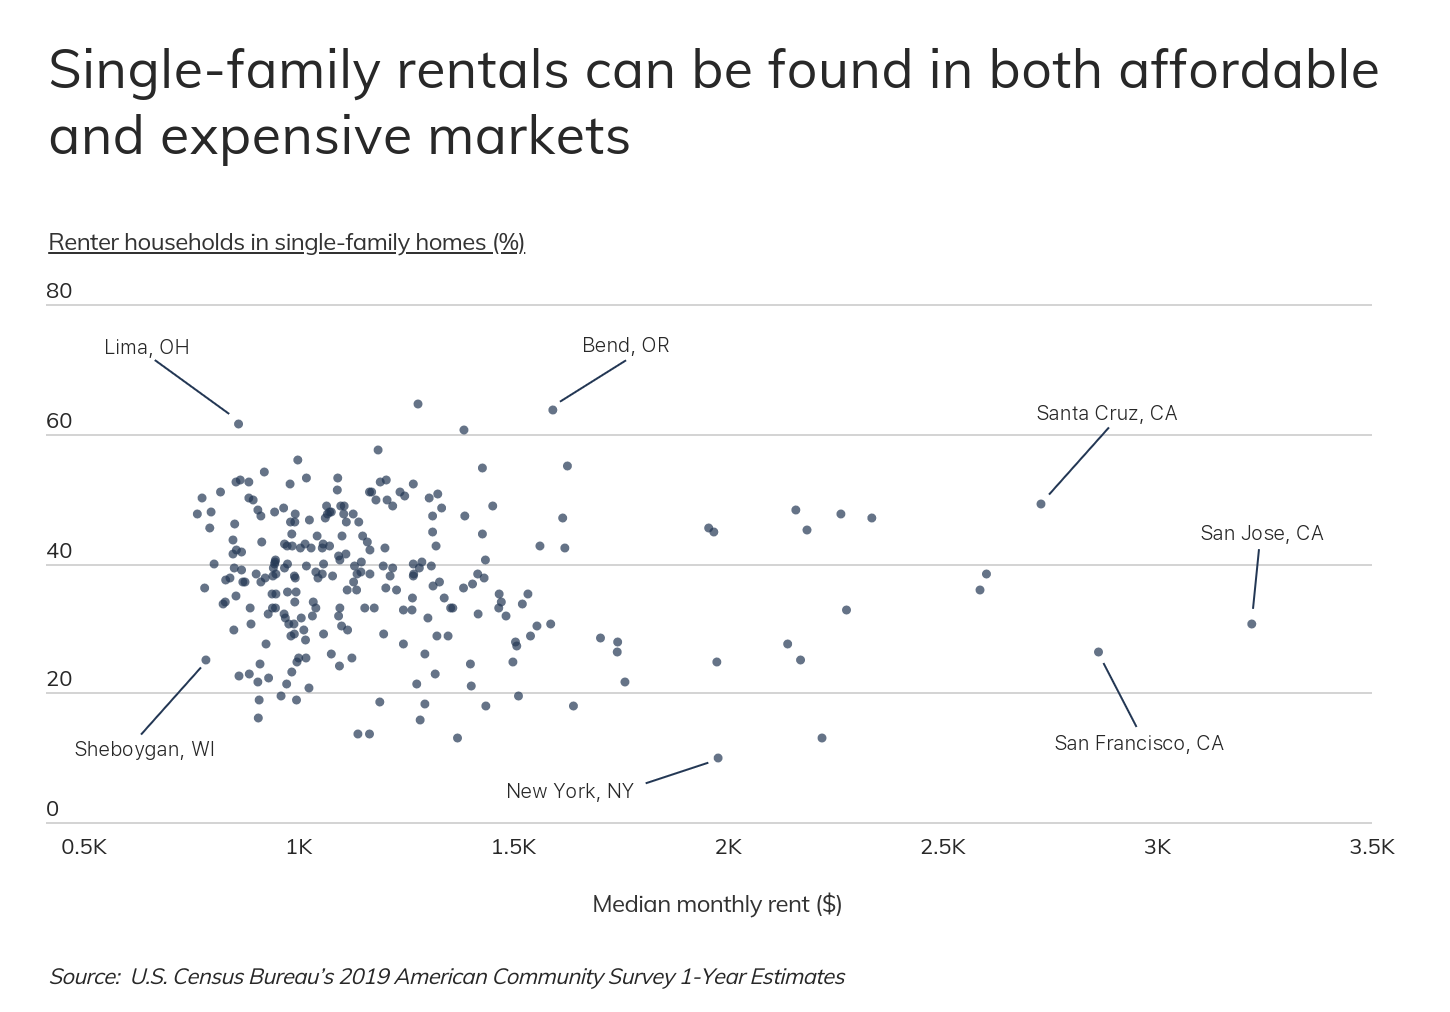
The data used in this analysis is from the U.S. Census Bureau’s 2019 American Community Survey 1-Year Estimates. Single-family rentals were defined as “renter-occupied housing units” with a single detached or attached unit in the structure. To find the locations with the most single-family rentals, researchers calculated the proportion of renter households in structures with one unit. To improve relevance, only metropolitan areas with at least 100,000 residents were included. Additionally, metros were grouped into cohorts based on population size: small (100,000–349,999), midsize (350,000–999,999), and large (1,000,000 or more).