

More than 50% of the households in Cleveland are occupied by renters, making the market perfect for rental property investors. In fact, Cleveland.com reports that the housing price surge in the metro area is expected to continue, which could increase the demand for rental property in Cleveland even more.
The real estate market in Cleveland is competitive, with some homes going under contract the same day they are listed. One reason homes are selling quickly in Cleveland is that prices here are still very affordable, with the median listing price for a home in Cleveland only $115,000.
The diversified economy helps keep the rental market strong in Cleveland. For a city that once relied on the manufacturing industry for growth, Cleveland has done a remarkable job of transforming its economy into a well-balanced blend of service, high tech, blue and white collar employment.
Located along the southern shore of Lake Erie, Cleveland is just across from the Canadian border. The metro area is home to the Rock and Roll Hall of Fame, one of the world’s finest orchestras, and major professional baseball, football, and basketball teams.
Here’s why Cleveland could be a great place to invest in rental property in 2022.
>>Explore Roofstock's Cleveland properties here.
Population growth
Let's take a look at some of the population data for Cleveland:
Key Population Stats:
- The MSA of Cleveland has seen its population shrink over 6% between 2010 to 2020.
- Cleveland has a city population of nearly 373,000 and a metropolitan population of more than 2 million, ranking Greater Cleveland as the 34th-largest metro area in the U.S.
- Population of Cleveland has declined 0.42% year-over-year while median household incomes grew by 1.82%.
Job market
The unemployment rate in Cleveland is down to just 5.5% (as of April 2022), according to the U.S. Bureau of Labor Statistics (BLS). As the economy in Cleveland continues to recover, job sectors showing the fastest signs of growth include construction, trade and transportation, professional and business services, and leisure and hospitality.
While job growth in Cleveland has historically lagged behind some of the city’s peers, a recent report in Cleveland.com notes that per capita GDP in Cleveland surpassed Sun Belt metros such as Phoenix, San Antonio, and Las Vegas.
The renewed focus on space exploration is good news for the fuel cell industry and the NASA Glenn Research Center in Cleveland. Companies with corporate headquarters in Cleveland include Applied Industrial Technologies, Cliffs Natural Resources, and Sherwin-Williams Company. The Federal Reserve Bank of Cleveland, one of only 12 Reserve Banks in the U.S., is in downtown Cleveland.
Key Employment Stats:
- GDP of Cleveland is nearly $114.3 billion, an increase of more than 6% over the past 10 years.
- Employed population of Cleveland declined by 0.54% year-over-year, while median household incomes have increased by 1.82% over the same period.
- The healthcare sector is one of the major employers in Cleveland, including the Cleveland Clinic, University Hospitals of Cleveland, MetroHealth, and Medical Mutual of Ohio.
- Biotechnology, fuel cell research, and technology are three of the growing employment sectors in Cleveland. In fact, according to Cleveland.com, many Silicon Valley high-tech workers are choosing to relocate to Cleveland and Ohio.
- Despite the shift to professional service and high tech business, construction and manufacturing in Cleveland still account for a significant amount of employment growth. Nearly 3,000 new manufacturing jobs were created over the last couple of years, while the construction industry added more than 1,700 new jobs during the same period.
- Since 2009, per capita income in Cleveland has steadily grown and is now at $34,743 while median household income is $57,263.
- Nearly 32% of the adults in Cleveland hold an undergraduate degree or higher, about 10% higher than the rate in Ohio.
- Cleveland is served by five Interstate Highways and several freight railroads. The Port of Cleveland is a major bulk freight terminal on Lake Erie.
- More than 5.1 million domestic and international passengers traveled through the Cleveland Hopkins International Airport (CLE) through September 2021, while shipping facilities at CLE have handled more than 63,000 tons of cargo over the same time period.
- Playhouse Square in Cleveland is the 2nd-largest performing arts center in the country, right behind New York’s Lincoln Center, and the Cleveland Museum of Arts is home to more than 40,000 works.
- Real estate investors who are pro sports fans will find Cleveland offers a winning combination: Major League Baseball’s Cleveland Indians, the NFL’s Cleveland Browns, and the NBA’s Cleveland Cavaliers.
Real estate market
Cleveland is ranked as the #1 best city in America to buy a home by Money Crashers, based on relative prices compared to regional and national averages, and prospects for further appreciation. The affordability of single-family homes in Cleveland is especially appealing to remote real estate investors and to people working from home.
Successful real estate investors know how to make money in any market cycle, which is one reason people are investing in Cleveland rental property. Cleveland is one of the most recession-resistant markets in the U.S., according to Crain’s Cleveland Business.
When measured by the investment variables of home price volatility, home sales flips, average loan-to-value, and home price-to-income ratio, Cleveland ranks as one of the top four markets with the lowest risk of a real estate dip.
Key Market Stats:
- Zillow Home Value Index (ZHVI) for Cleveland is $109,258 through May 2022.
- Home values in Cleveland have increased by 20.9% over the last year.
- Over the past five years home values in Cleveland have increased by nearly 115%.
- Median list price of a single-family home in Cleveland is $115,000 based on the most recent report from Realtor.com (April 2022).
- Median listing price per square foot of a home in Cleveland is $82.
- Days on market (median) is 48.
- Median sold price for a single-family home in Cleveland is $125,200.
- Sale-to-list price ratio is 100%, with homes in Cleveland selling for approximately the asking price.
- Of the 40 neighborhoods in Cleveland, Tremont is the most expensive with a median listing price of $440,000.
- Most affordable neighborhood in Cleveland to buy a home is South Collinwood with a median listing price of $59,900.
Strong renters’ market
Demand for housing in Cleveland is high and inventory is low, with the average home price up to $236,873, according to the April 2022 report for Cuyahoga County from the Akron Cleveland Association of Realtors. Buyer in the metro area need to act quickly, with the inventory of available homes down to just a 1.3 month supply and the number of active listings down nearly 7.9% year over year.
Rising home prices in Cleveland are helping to create a strong demand for single-family rental property, with over half of the housing units occupied by renters. Along with Cincinnati and Dayton, rental property in Cleveland can provide investors with cash flow combined with solid appreciation over the long term.
Key Market Stats:
- Median rent in Cleveland is $1,100 per month for a 3-bedroom home, based on the most recent research from Zumper (June 2022).
- Rents in Cleveland have increased by 10% over the last year and increased by about 20% over the past 3 years.
- Rents are still relatively affordable in Cleveland. In fact, over 60% of the housing units rent for less than $1,500 per month.
- 55% of the households in Cleveland are occupied by renters.
- Most affordable neighborhoods in Cleveland for renters include North Broadway, Mount Pleasant, and South Collinwood where rents are less than $850 per month.
- Most expensive areas in Cleveland to rent include Downtown Cleveland, Hough, and Tremont where rents range between $2,250 and $2,550 per month.
Historic price changes & housing affordability
Reviewing historic price changes and affordability are two methods real estate investors use to decide whether or not to invest in a specific area. Short- and long-term price changes help guide investment strategy, while affordability is one way to gauge the potential demand for rental housing.
The most recent Freddie Mac House Price Index (FMHPI) report for the Cleveland-Elyria, OH MSA reveals:
- April 2017 HPI: 107.4
- April 2022 HPI: 163.1
- 5-year change in home prices: 51.8%
- One-year change in home prices: 11.9%
- Monthly change in home prices: 1.0%
Using research from ATTOM Data Solutions, Kiplinger conducted a home price and affordability study of the top 100 housing markets in the U.S.:
- Since the last real estate cycle market peak in May 2006, home prices in Cleveland have decreased by 2.5%.
- Since the last real estate cycle market bottom in March 2012, home prices in Cleveland have increased by 78.4%.
- Cleveland has an affordability index of 1 out of 10, meaning the metro area is one of the more affordable places to own a home in the U.S.
Quality of life
Forbes rated the Cleveland metropolitan area as one of the best places in the U.S. for business and careers. Unemployment is down to 5.5%, household incomes are growing, and the cost of living is 11% below the national average.
Key Quality of Life Stats:
- University Circle in Downtown Cleveland is home to the city’s cultural, educational, and medical institutions including the Cleveland Museum of Natural History, Case Western Reserve University, and University Hospitals.
- I.M. Pei designed the Rock and Roll Hall of Fame, located along the Lake Erie waterfront, near other popular attractions like the World War II submarine USS Cod and the Great Lakes Science Center.
- The Red Line Rapid Train is known as one of the best mass transit systems in the country.
- Cleveland Clinic and University Hospitals are renowned for their world-class healthcare services.
- Neighborhoods on the east side and west side of Cleveland feature a wide variety of housing options including historic homes, condos, and apartments.
Get out the map
Where to begin your search? Roofstock created a heat map of Cleveland based on our Neighborhood Rating, a dynamic algorithm that enables you to make informed investment decisions by measuring school district quality, home values, employment rates, income levels and other vital investment criteria.
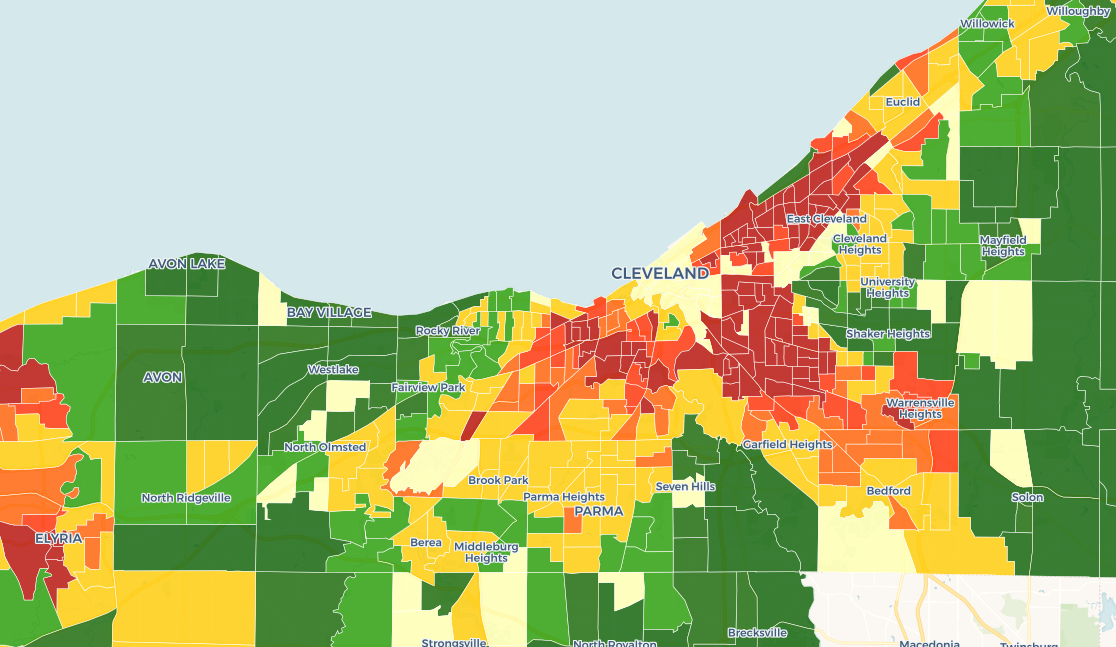
DARK GREEN: 4-5 star neighborhood
LIGHT GREEN: 3.5-4 star neighborhood
YELLOW: 2.5-3 star neighborhood
ORANGE: 2 star neighborhood
RED: 1 star neighborhood
Ready to invest in the Cleveland housing market? If you haven't already done so, create your free Roofstock account and set up alerts. We'll notify you when we have a Cleveland investment property that matches your search criteria.