
Investing in real estate can be confusing because there are so many different ways to analyze a rental property investment. The good news is that all metrics to evaluate real estate are very easy to use, and each one provides valuable information to the investor.
Here’s a look at the 15 most important real estate metrics for rental property investors to use in their business.
Why Real Estate Metrics Matter
All real estate metrics are important, but some more so than others depending on your investment process and strategy.
When you’re analyzing potential investments, you may pay more attention to the capitalization rate and the gross rent multiplier. Once the home is rented and turned over to a preferred local property manager, cash flow and occupancy/vacancy ratios might matter more.
Whether you’re brand new to the business or already have several rental properties under your belt, here are the 15 most important real estate metrics every investor should know.

1. Cash Flow
You’ve probably heard the saying that cash is king, and that’s absolutely true in the world of investment real estate. Cash flow is money you have left over at the end of the month, once all of the bills have been paid. If your monthly rental income is $1,500 and your bills total $1,200, your cash flow is $300 per month.
- Cash Flow = Total Income – Total Expenses
2. Cash on Cash Return
Cash on cash (CoC) return compares the cash you receive for each dollar invested. The cash on cash return metric takes into account all of your operating expenses, including your mortgage.
To calculate CoC return, simply divide the cash you receive each year by the total cash invested. For example, if you financed a rental property using a down payment of $25,000 and received $3,600 in cash each year, your cash on cash return would be 0.144 or 14.4%.
- Cash on Cash Return = Cash Received / Cash Invested
3. Gross Operating Income
Gross operating income (GOI) is calculated by subtracting estimated vacancy and credit losses from your total potential rental income, then adding in other sources of income.
Let’s use a small 3-unit multifamily property as an example. If each unit rents for $1000 per month, the total potential income is $36,000 per year. Assuming a vacancy rate of 8%, the effective rental income would be $33,120 ($36,000 x 8% vacancy loss = $2,880).
Add in miscellaneous income such as $100 received each month from coin-operated laundry, and your GOI is $34,320.
- Gross Operating Income = (Total Potential Income – Vacancy Allowance) + Miscellaneous Income

4. Operating Expense Ratio
The operating expense ratio (OER) indicates how well expenses are being managed compared to the income being received. To calculate OER, divide your operating expenses by the property’s operating income.
If a home’s operating expenses are $14,400 per year and the annual gross operating income (GOI) is $18,000, the OER is 80%. In other words, 80% of your income is being used to pay operating expenses and the mortgage.
Ideally, the OER should stay the same or go down over time. If the operating expense ratio increases, it means the rent is not rising fast enough to match increased costs. On the other hand, if the OER ratio decreases, it’s a sign that the property is being efficiently managed.
- Operating Expense Ratio = Operating Expenses / Gross Operating Income
5. NOI
Net operating income (NOI) measures how much money the property makes after all operating expenses are paid, except for the mortgage. Debt service and mortgage payments are excluded from the NOI calculation because investors may use different amounts of leverage, obtain loans varying loan terms, or pay for a property all in cash.
If a single-family rental house generates an annual gross operating income (GOI) $18,000 and the operating expenses (excluding the mortgage) are $8,500, the NOI is $9,500.
- NOI = Gross Operating Income (GOI) – Operating Expenses (excluding debt service)
How to track all these metrics for your rental properties...
Now real estate investors can easily maximize profits through smart money management, automated income and expense tracking, personalized reporting and more using Stessa. Sign up for free today.
![stessa-mac-mockup-2800-2500[4]](https://learn.roofstock.com/hs-fs/hubfs/stessa-mac-mockup-2800-2500%5B4%5D.jpg?width=501&name=stessa-mac-mockup-2800-2500%5B4%5D.jpg)
6. Capitalization Rate
Capitalization rate – also known simply as the cap rate – estimates the potential return of a rental property by dividing the NOI by the property market value or cost. Because cap rates vary from market to market for the same property, the capitalization rate calculation should only be used to compare similar properties in the same market or neighborhood.
The cap rate formula can also be used to calculate what the market value of a rental property is based on the NOI and market cap rate, and to calculate what the NOI should be based on the property value or asking price and market cap rate. For example, if the NOI of a property is $9,500 and the sale price is $158,333 the cap rate is 0.06 or 6%.
- Cap Rate = NOI / Property Cost or Value
- NOI = Property Cost or Value x Cap Rate
- Property Value or Cost = NOI / Cap Rate
7. IRR
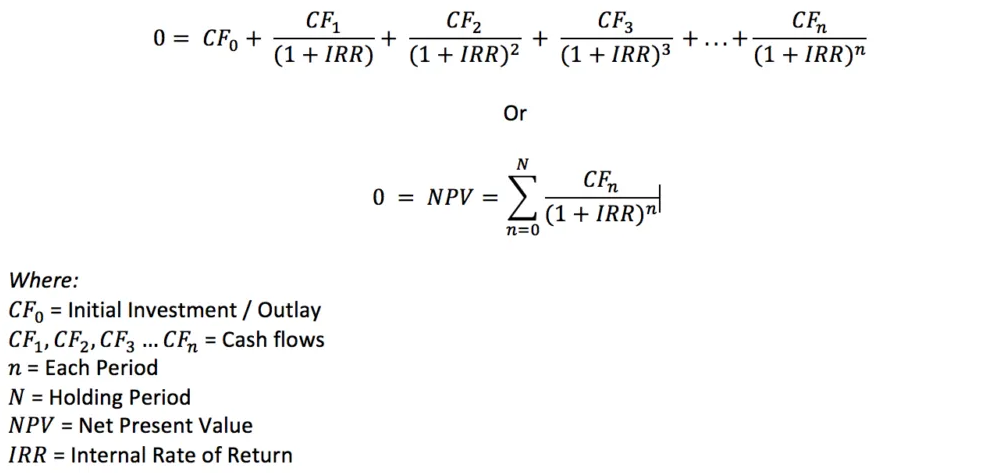
Internal rate of return (IRR) – also known as annualized return - measures a rental property’s potential profitability by taking into account purchase cost and sales proceeds, varying cash flows throughout the holding period, and discounting for the time value of money (TVM).
In simple terms, TVM means that a dollar received today is worth more than a dollar received in the future. Generally speaking, the higher the IRR of a rental property is the more attractive it is to purchase, everything else being equal.
Here is what the IRR formula looks like, as published by the Corporate Finance Institute (CFI):
Fortunately, there are easier ways to calculate the IRR of a rental property:
- IRR Calculator.net has an online calculator for determining the IRR.
- You can use the free rental property analyzer in this article to forecast the potential return of a property. Simply enter some information to view projected key return on investment (ROI) metrics, including cash flow, cash-on-cash return, net operating income, and cap rate.
8. Rent/Cost
The rent/cost ratio is an easy “back of the napkin” calculation that investors of single-family homes and small multifamily properties can use to narrow down the list of potential rental property investments.
However, as with the cap rate calculation, the rent/cost calculation should only be used to compare similar properties in the same market or neighborhood.
As an example, if the rent from a single-family home in a neighborhood with a 3-star rating is $1,200 per month and the property price is $114,000, the rent/cost ratio is 0.010 or 1%.
- Rent/Cost = Monthly Rent / Property Price
9. 50% Rule
The 50% rule is another quick and easy calculation real estate investors use to estimate what the normal operating expenses of a property should be, excluding the mortgage payment. Operating expenses include items such as leasing and property management fees, repairs and maintenance, and property taxes and insurance.
If a home generates a rent of $1,200 per month the monthly operating expenses should be about $600, based on the 50% rule.
- Operating Expenses = Monthly Rent (Operating Income) x 50%
10. 70% Rule
The 70% rule is used for properties that require a significant amount of updating, by fix-and-flip real estate investors, and by real estate wholesalers.
Investors use the 70% rule to determine the maximum allowable offer (MAO) price to offer based on rehab expenses and the property’s estimated after repair value (ARV). For example, if rehab expenses are $30,000 and the estimated ARV is $165,000, the MAO is $85,500.
- Maximum Allowable Price = (After Repair Value x 70%) – Rehab Costs
11. GRM
Gross rent multiplier (GRM) is used by rental property investors to estimate property value. GRM is calculated by dividing the property value or asking price by the annual gross rental income the home generates.
The gross rental multiplier formula does not factor in operating expenses or rental income lost to vacancy. If a home rents for $1,200 per month (or $14,400 per year) and the property price is $114,000, the GRM is 7.92.
- Gross Rent Multiplier = Property Value / Annual Gross Rental Income
12. LTV
Loan to value (LTV) ratio is an important real estate metric and investors and lenders use to measure the amount of leverage or debt when a rental property is financed.
Although some real estate investors try to make as small of a down payment as possible, property financed with a high LTV can have negative cash flow if operating expenses are higher than estimated or vacancy periods are longer.
As a rule of thumb, both banks and rental property investors expect a down payment of 25% of the purchase price, creating an LTV of 75%. For example, if a home has a purchase price of $150,000 and the investor makes a $40,000 down payment, the LTV would be 73.3%.
- Loan to Value = Loan Amount / Property Price
13. DSCR
Debt service coverage ratio (DSCR) compares the operating income a rental property generates to the total amount of debt. DSCR is calculated by dividing the property’s net operating income (NOI) by the mortgage payment.
The higher the DSCR is, the more income there is available to pay for operating expenses and vacancy periods that are longer than expected.
If a home’s NOI is $9,500 and the annual mortgage payment (P&I) is $5,712, the DSCR is 1.67. Most lenders require a DSCR of at least 1.25 before making a loan on an investment property in order to offer the best interest rates and terms to rental property investors.
- Debt Service Coverage Ratio = Net Operating Income / Mortgage Payment

14. Vacancy
Vacancy rate is calculated by dividing the number of days a rental property is vacant by the 365 days in the year. For example, if it takes three weeks to make repairs, market a vacant property for rent, screen a new tenant and sign the lease, the vacancy rate would be 5.8%.
Most real estate investors use a ‘standard’ vacancy rate of between 5% - 10%, which is the same thing as saying a home will be vacant for between 18 - 37 days from the time the old tenant leaves to the time a new tenant moves in.
- Vacancy Rate = Number of Days Vacant / 365 Days per Year
15. Depreciation
Depreciation is a non-cash expense real estate investors use to reduce taxable net income.
The IRS allows residential rental property owners to depreciate the value of a home (excluding the land cost) over a period of 27.5 years. That means if the property value of the building and improvements is $140,000, an investor can use a depreciation expense of $5,091 each year to offset taxable net income.
- Depreciation Expense = Property Value (excluding land) / 27.5 years