Successful rental property investors know that profits are made when real estate is bought, not when it’s sold. But how do investors know if a deal they’re looking at really makes sense?
In this article we’ll answer that question and much more.
We’ll begin by reviewing how a rental property analysis works, talk about why cash flow is critical, and give you two free rental property analysis spreadsheets and tools that you can start using today.
(Click here if you'd prefer to jump straight to the spreadsheet)
Basic Steps of a Rental Property Analysis
There are four main steps to follow when doing a rental property analysis:
1. Determine market valueReal estate investors have a wide variety of tools at their disposal to help determine the market value of a house:
- CMA or comparative market analysis reports what similar homes have recently sold for and how much they are currently listed for
- Financial metrics such as cap rate and GRM (gross rent multiplier)
- 1% Rule states that the monthly rent of a property should be equal to or greater than 1% of the purchase price – if the monthly rent is $1,000 the property is worth about $100,000
The cost of owning and operating a single-family investment property includes a variety of expense items such as taxes, management and leasing fees, utilities, maintenance and capital repairs.
Some investors “ballpark” the operating expenses by using something called the 50% Rule. The 50% rule assumes that operating expenses (excluding the mortgage principal and interest payment) will be half of the gross income. So, if a single-family house rents for $1,000 per month the monthly operating expenses will be $500.
While the 50% Rule may be a good initial screening tool to use when choosing potential investments to analyze further, it’s better to use historical expenses or conduct detailed research to learn exactly how much a rental property will cost to own.
3. Research market rents
Online sources such as Rentometer, Zillow , and RENTCafé are excellent sources for finding real-time rent information in almost every market in the U.S. Another good technique for researching market rents is to ‘secret shop’ other rental properties in the area by pretending to be a tenant.
4. Estimate any needed rehab and updating costsYour property manager can assist with obtaining multiple quotes for any work, and also advise whether the local government will require a licensed contractor to do the job or allow the use of a less expensive handyman.

Analyzing cash flow
There are 2 ways that rental property investors make money: through equity appreciation over the long term and through cash flow over the entire holding period.
Equity gains grow faster near the end of the loan term, because a larger percentage of the monthly mortgage payment is applied toward principal. Historically, housing prices in the U.S. have also outpaced the rate of inflation.
So, it’s not unreasonable for a buy-and-hold real estate investor to anticipate healthy gains in equity.
However, because real estate markets also historically move in cycles, trying to time the market and maximize appreciation by waiting for a higher price to sell can sometimes backfire. That’s why so many successful real estate investors focus on cash flow when analyzing property to invest in:
- Values of single-family homes that have similar characteristics tend to move in the same direction, meaning that their future appreciation potential is about the same
- Financing for single-family homes is also similar, so the principal balance will be paid off at about the same rate, meaning that the equity gains near the end of the loan term will also be about the same
That’s why real estate investors compare the cash flow of two similar properties.
Because the potential gain from equity is about the same, cash flow becomes the differentiating factor. Everything else being equal, the house with the greater cash flow is the better investment.
How to analyze cash flow
Cash flow is the difference between income and expenses. While that definition is pretty simple, accurately analyzing and calculating cash flow can be a little more difficult.
That’s because many beginning real estate investors are too optimistic. They often overestimate the gross rental income and underestimate operating costs, or the true cost of owning a rental property.
A good cash flow analysis includes:
Gross rental income
One big mistake some investors make is projecting that rents will always go up year after year. Instead of forecasting a straight line annual rent increase of 3% (for example) talk to other investors in your market to learn what their historic rent increases have really been.
Vacancy/credit loss
Many cash flow proformas use a vacancy/credit loss of 5% of the gross annual income. Vacancy is the time it takes to find a new tenant – or turn the unit – when the property isn’t producing income. Credit loss is another word for bad debt created by tenants who don't pay in full.
The number of days that 5% equates to is about 18 days. Rather than using 5%, talk to a local Roofstock property management company to get their input on how long it really takes to find a new tenant. You may find that 5% is too low or even too high if the demand for rental property in the market is strong.
Property management
Since you’re speaking with a professional property manager, ask them about their fee structure and learn what services are included and which may generate extra fees. The industry standard runs between 8% - 12% of the gross monthly rental income, while others may charge a flat fixed fee per unit or offer a discount to an investor with multiple properties.
Extra fees may be charged for services like leasing to a new tenant and setting up a new client account. These fees reduce the property cash flow, but beginning investors often forget to include them in a cash flow analysis.

Maintenance
Maintenance includes the cost of repairing or replacing items such as a clogged plumbing line, rehanging a closet door, replacing a worn out appliance, servicing the HVAC, or fixing the roof. Some investors calculate the maintenance expense as 10% of the gross rent, while other owners make an itemized list with the cost of individual tasks and repairs.
The age of the house and the tenant demographic also affect the cost of maintaining the property.
Older houses – unless they’ve been completely rehabbed and updated – will generally cost more to maintain than new construction.
Utilities
Tenants in single-family homes usually pay their utility bills directly, but in smaller multifamily properties landlords often pay for the water, sewer, and trash then pass that expense through to the tenant.
Even if the tenant pays their own utility bills it’s a good idea to check with the local utility to see what the bills are each month.
A higher than normal utility bill could end up making the property too expensive to the tenant, which in turn creates a higher vacancy rate and lower cash flow. Depending on the municipality, some utilities may also hold the landlord responsible for a tenant’s unpaid bill, creating an unexpected expense on the cash flow statement.
HOA fees
Owning a house that is part of a homeowners’ association also means paying an HOA fee, usually once a month. It is a good idea to ask the HOA for a copy of their annual P&L and balance sheet.
That’s because, while the HOA’s profit & loss statement may seem strong, a weak balance sheet means the HOA is undercapitalized and may need to issue a special assessment to every property owner in the association.
Mortgage
Mortgage payments are usually made up of PITI – or principal, interest, property tax, and insurance. If your monthly loan payment doesn’t include all of these items, be sure to account for the missing ones in your cash flow analysis.
Other expenses
This category may include nonrecurring expenses such as leasing fees, pest control, snow removal, landscaping, and tax deductible travel expenses for long distance real estate investors.
Simple spreadsheet for rental property analysis
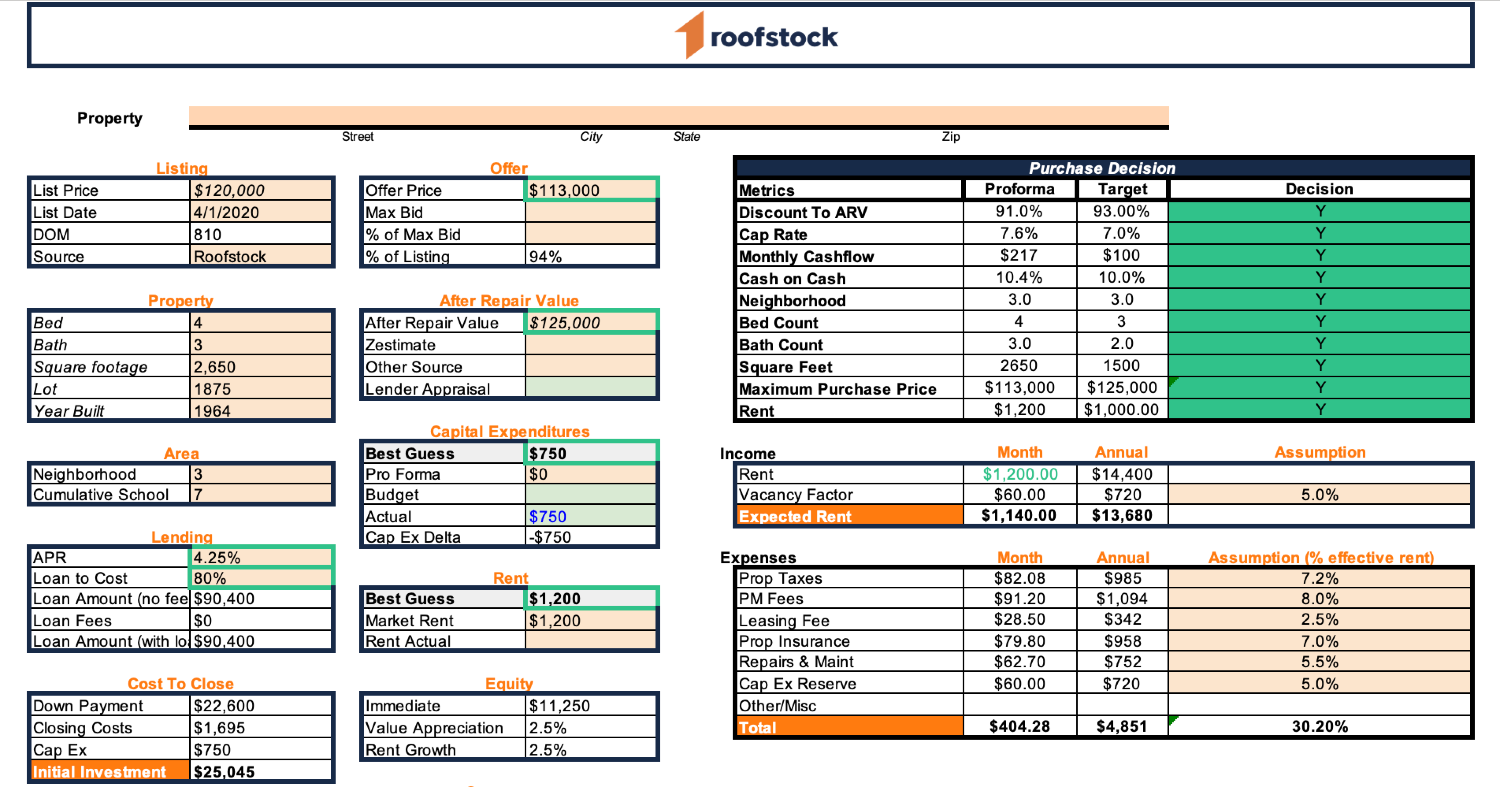
To illustrate how a rental property analysis works in the real world, we’ve put together a simple spreadsheet using Google Sheets (but you can also download a copy into excel if you prefer to use that):

Download this simple spreadsheet for rental property analysis now
Have existing properties that you want to track the performance of? Ditch the spreadsheets and check out Stessa. Get 24/7 visibility into your portfolio’s performance with reports that are automatically generated and updated in real time. Create income statements, balance sheets, cash flow reports, collect rent, screen tenants and more, in just a couple clicks. Best of all, it’s free to get started.
Other financial metrics to measure
A good rental property analysis spreadsheet also allows real estate investors to create other key financial metrics to help weigh the pros and cons of alternative investment options:
- Cash-on-cash return = Net annual cash flow / Cash invested
- Cap rate = NOI (net operating income before mortgage payment) / Market value of property
- Gross rent multiplier = Market value / Gross annual rents
- Gross rental yield = Gross annual rent / Market value


